Summary
Aotearoa New Zealand is becoming more ethnically diverse, and this is changing quickly. It is fastest in urban areas, but diversity is increasing across the country. In the future, more of our learners will be from ethnic communities and speak a wider variety of languages. By 2043, it is expected that more than one in four learners in Aotearoa New Zealand will be from an ethnic community. In Auckland, it is expected that more than two in five learners will be Asian.
It is critical that education meets the needs of all our children. This report finds that many learners from ethnic communities are succeeding in education but encounter racism, isolation, and lack of cultural understanding.
We must achieve significant change if Aotearoa New Zealand is to be a great place to learn for children and young people from ethnic communities.
This is a draft for consultation – we are seeking your feedback
- You can make a submission through the following link: https://www.surveymonkey.com/r/DraftLTIBSubmission
- Questions are available in the following languages: English, Arabic, Chinese (Simplified), Hindi, Japanese, Khmer, Korean, Spanish, Tagalog, Vietnamese
- You do not have to answer all questions.
The closing date for submissions is Tuesday 20 December 2022.
You can read a short summary of this report here: Education For All Our Children: Embracing Diverse Cultures - Summary of draft for consultation | Education Review Office (ero.govt.nz)
Whole article:
Education For All Our Children: Embracing Diverse Cultures - Draft for consultationAcknowledgements
We acknowledge and thank all the learners, parents and whānau, leaders, teachers, and others who shared their experiences, views, and insights through interviews, group discussions, and surveys. We thank you for giving your time, and for sharing your knowledge and experiences so openly and whole‑heartedly.
We also thank the key people from the Ministry for Ethnic Communities, the Ministry of Education, and the Human Rights Commission for their support in delivering this report, and those who participated in interviews.
We also thank the individuals and organisations who made submissions on the topic consultation we held in March 2022.
We want to give special acknowledgement to Multicultural New Zealand for distributing the surveys through their networks.
We want to acknowledge and thank the members of the Expert Advisory Group who shared their knowledge and wisdom in guiding this evaluation.
The members were:
- Dr Angel Chan, Senior Lecturer, School of Curriculum and Pedagogy, Faculty of Education and Social Work, University of Auckland
- Sarah Denny, Hagley Community College
- Professor Stephen May, Te Puna Wānanga (School of Māori and Indigenous Education), Faculty of Education, University of Auckland
- Prem Singh, Multicultural New Zealand
- Nera Tautau, Human Rights Commission.
Executive summary
Aotearoa New Zealand is becoming more ethnically diverse, and this is changing quickly. It is fastest in urban areas, but diversity is increasing across the country. In the future, more of our learners will be from ethnic communities and speak a wider variety of languages. By 2043, it is expected that more than one in four learners in Aotearoa New Zealand will be from an ethnic community. In Auckland, it is expected that more than two in five learners will be Asian.
It is critical that education meets the needs of all our children. This report finds that many learners from ethnic communities are succeeding in education but encounter racism, isolation, and lack of cultural understanding.
We must achieve significant change if Aotearoa New Zealand is to be a great place to learn for children and young people from ethnic communities.
This report shares what we know about learners from ethnic communities’ experiences of education, and the implications for the future of Aotearoa New Zealand. This report looks at:
- Demographics: How has ethnic diversity changed in schools and how will it change going forward?
- Experiences and outcomes: What are the education experiences of learners from ethnic communities and their whānau?
- Practices and challenges: What are good practices and challenges in meeting the needs of learners from ethnic communities?
- Future: How can schools prepare for a more diverse future and how can they be supported?
What is ethnic diversity?
There are many forms of diversity including, among others, ethnic, cultural, language, identity, and religious diversity. For this project we focus on ethnic diversity and associated language, cultural, and religious diversity. Ethnicity is defined as the ethnic groups that people identify with or feel they belong to. Ethnic communities included in this report are African, Asian, Latin‑American, and Middle‑Eastern. The Ministry for Ethnic Communities defines ethnic communities as people who identify as African, Asian, Latin-American, Middle-Eastern, or Continental European. Due to the responses to our surveys, and the data available, we do not include Continental European learners’ experiences in this report.
What does ethnic diversity look like in Aotearoa New Zealand schools, and how is this likely to change?
Aotearoa New Zealand is becoming more ethnically diverse, and this is changing quickly. It is fastest in urban areas, but diversity is increasing across the country. Learners will be from a wider range of ethnic communities. By 2043, it is expected just over one in four (26 percent) learners will identify as Asian and around one in 20 (3.6 percent) will identify as Middle‑Eastern, Latin‑American, or African (MELAA). In Auckland, more than two in five (43 percent) learners will identify as Asian.
What are the educational experiences of learners from ethnic communities and their whānau?
Many, but not all, learners from ethnic communities achieve well in education. Looking at NCEA Level 2 results, Filipino, Indian, Japanese, Vietnamese, and Korean learners all achieve above the national average. However, there are significant differences across ethnic communities, and within all ethnic communities there are learners who are not achieving well.
Learners from ethnic communities often do not feel they belong. Nearly one in five learners reported they frequently feel they do not belong and a third feel lonely at school. Nearly one in five also feel they have to hide their ethnic identity at school or feel excluded from activities because of their ethnic identity.
Learners from ethnic communities experience widespread racist bullying, which too often is not taken seriously by their school. One in five learners have experienced racist bullying in the last month, and over half have seen others being bullied because of their ethnicity. Both whānau and learners report that racist bullying needs to be better identified and addressed at school.
Whānau from ethnic communities face barriers to engaging with schools. They attend parent information sessions more than any other activity but find information about their children’s learning insufficient or confusing. They are significantly under-represented on School Boards.
Many learners from ethnic communities go on to tertiary study, but pathways are confusing, and, for some, choices are unfairly constrained by teachers’ biases. More than one in four secondary learners report that teachers’ recommendations for their course selection are influenced by ethnicity, and only half of secondary learners are fully happy with their subject choices. Both learners and whānau find NCEA confusing.
How are schools meeting the needs of learners from ethnic communities and their whānau?
Teachers’ understanding of their learners, including their culture, is key to learners’ experiences at school, but this needs building. Whānau and learners are concerned about teachers’ lack of cultural knowledge and awareness. Teachers report having limited awareness of learners’ cultural and learning needs. More than half of teachers do not feel confident connecting with ethnic communities. Half of the learners from ethnic communities reported having their names mispronounced by their teacher.
Implications for education
Every school needs to be able to respond to increased diversity. Ethnic diversity is increasing across the country – not just in Auckland – and the largest changes are in the school-aged population. This increase in ethnic diversity is reflected in an increase in the diversity of cultural values, and the diversity of languages spoken. Every school needs to be able to meet the needs of learners from ethnic communities.
Every school will need to be able to tackle racism. In Aotearoa New Zealand there is more racism than we may be aware of. Too many learners from ethnic communities experience racist bullying and racial biases. We must do better.
We need to get better at delivering education for learners from ethnic communities. We need to understand more about what quality learning experiences and outcomes diverse ethnic communities want. This may include the types and locations of schools, and subjects taught. We must increase the cultural capability of the current teaching workforce, and develop a more culturally diverse teaching workforce for the future.
We need education to be good for learners and their whānau from ethnic communities to enable Aotearoa New Zealand to benefit from its increasing ethnic diversity. Learners and their whānau from ethnic communities have high aspirations for their learning and future pathways, and value maintaining their home languages. Supporting these aspirations and making Aotearoa New Zealand an attractive place to live for people of all ethnicities and cultures will help us strengthen our education system, workforce, culture, and relationships with other countries.
Key focus areas for the future
Many learners from ethnic communities are achieving in education but they have to overcome widespread racism, isolation, and lack of cultural understanding. We need to change. We will need action in five areas to ensure Aotearoa New Zealand is well-placed for the future.
- Strengthen understanding of ethnic communities and what they want from education. Ethnic communities have a wide variety of perspectives, values, and priorities for education. We need to strengthen our understanding of these within the education context.
- Develop our thinking on how we meet the needs of learners from ethnic communities in Aotearoa New Zealand. By deliberately exploring how we navigate differing religions and cultural values, and the intersection between ethnicity, language, culture, and identity in Aotearoa New Zealand’s education system, we can more effectively plan for the future.
- Recognise racism, understand the impacts, and tackle it more effectively. In some schools, teachers, learners, and others continue to allow ignorance, unconscious bias, and stereotyping to affect the way they engage with learners from ethnic communities and their whānau. This impacts on learners’ experiences of bullying, expectations of them, and options for their future study. Collectively, we need to end racism.
- Proactively build a teaching workforce that is better able to meet the needs of learners from ethnic communities and their whānau. To ensure learners from ethnic communities have teachers that understand them and meet their learning needs, we need to transform the teaching workforce.
- Harness the opportunities made available by the increasing ethnic diversity in Aotearoa New Zealand. Increasing ethnic diversity brings with it a wide range of opportunities that could strengthen not only Aotearoa New Zealand’s education system but our culture and economy. We need to realise these opportunities.
These are not quick actions; they will require sustained effort over coming decades. But the cost of not acting will be immense not only for the more than one in four learners from ethnic communities by 2043, but for New Zealand’s social cohesion, economy, and future.
Conclusion
Aotearoa New Zealand is becoming increasingly ethnically diverse. We must be a better place for learners from ethnic communities and their whānau. This will, in turn, put us in a stronger position economically and culturally as we become an even more attractive place for people from diverse ethnic communities to live, learn, work, and raise their families.
We are seeking your feedback
- You can make a submission through the following link: https://www.surveymonkey.com/r/DraftLTIBSubmission
- Questions are available in the following languages: English, Arabic, Chinese (Simplified), Hindi, Japanese, Khmer, Korean, Spanish, Tagalog, Vietnamese.
- You do not have to answer all questions.
The closing date for submissions is Tuesday 20th December 2022.
About this report
Aotearoa New Zealand society is changing. The Education Review Office, in partnership with the Ministry for Ethnic Communities, wanted to understand the experiences of learners from ethnic communities and their whānau, and to explore the implications for the future of education.
This report describes what we found and the changes needed.
About the Education Review Office
The Education Review Office | Te Tari Arotake Mātauranga (ERO) is the Aotearoa New Zealand Government’s education evaluation agency. We work with early learning services, kōhanga reo, schools, and kura to help them and their learners flourish. We are interested in what is working well and what can improve.
Our focus is on equitable and excellent outcomes for all learners and our approach is driven by our whakataukī:
Ko te Tamaiti te Pūtake o te Kaupapa | The Child – the Heart of the Matter.
ERO is responsible for reviewing and reporting on education performance. As part of this role, ERO looks at how the education system supports learners’ outcomes – in this case on education for learners from ethnic communities in schools.
This is a Long-Term Insights Briefing
A Long-Term Insights Briefing (LTIB) helps identify and explore issues that matter for the future wellbeing of the people of Aotearoa New Zealand. They provide information about medium- and long-term trends, risks, and opportunities, and explore options on how best to respond.
LTIBs look to the past and present to think about the future – they are not Government policy. Chief Executives have a statutory duty to produce these briefings independent of Ministers. More information about LTIBs is on the Department of Prime Minister and Cabinet website (see here).
This report is about making a difference
This report describes what we found about the increasing ethnic diversity in Aotearoa New Zealand, and the quality of education provision for learners from ethnic communities in schools. We also look at the implications of increasing ethnic diversity for the future.
The voices of learners from ethnic communities and their whānau are highlighted throughout this report. We describe their experiences of participation and learning, their outcomes, and how teaching practices impact on their learning and lives. Whānau’ refers to the extended family of these learners to acknowledge the importance of their close relationships and connections.
By providing a better understanding of diversity, this report will help schools and the education system to better prepare and plan for more diverse school environments.
Through understanding the experiences of these learners and showcasing good practice, this report will enable schools to better respond to the diverse ethnicities in their communities.
We partnered with others and drew on their expertise
For this evaluation, ERO partnered with the Ministry for Ethnic Communities.
The newly established Ministry for Ethnic Communities is the Government’s chief advisor on ethnic communities, ethnic diversity, and the inclusion of ethnic communities in wider society. They work with communities, other government agencies, and a range of organisations to help increase social cohesion and ensure Aotearoa New Zealand is a place where everyone feels welcome, valued, and empowered to be themselves.
We also worked closely with the Ministry of Education, and an Expert Advisory Group with a range of expertise, including people from ethnic communities, academics, practitioners, and agency officials.
Public consultation guided us to our questions
In March 2022, we published a LTIB topic consultation document1 and asked for submissions. The consultation document was available in seven languages (English, Te Reo Māori, Arabic, Chinese (Simplified), Hindi, Japanese, Korean). Public consultation ran from 3 March to 1 April 2022. The consultation was communicated using ERO’s existing channels and through our partner networks. This included invitations to 169 organisations representing different ethnic, religious, or cultural groups, as well as peak bodies in education.
In May 2022, we published a LTIB: Summary of submissions and topic decision document.2 We received 21 submissions, 18 on behalf of organisations and three from individuals. The organisations comprised groups with a specific ethnic, cultural, or religious affiliation, as well as pan-ethnic, religious, or education groups. As a result of feedback, the title of the LTIB was changed to: Embracing diverse cultures: School practices. We have since changed it to the current title; Education for all our children: Embracing diverse ethnicities.
The word ‘embracing’ was chosen as it better aligns with the New Zealand Curriculum expectations for an inclusive and responsive curriculum.
A summary of submissions can be found here.
More details about our engagement approach are in Appendix 1.
What we looked at
- Demographics: How has ethnic diversity changed in schools and how will it change going forward?
- Experiences and outcomes: What are the education experiences of learners from ethnic communities and their whānau?
- Practices and challenges: What are good practices and challenges in meeting the needs of learners from ethnic communities?
- Future: How can schools prepare for a more diverse future and how can they be supported?
Where we looked
We focused on gathering the views of whānau and community leaders in ethnic communities in the context of English medium schools. To ensure we captured a range of experiences across a variety of learning contexts, we surveyed learners, whānau and communities, school leaders and teachers from a range of school types.
How we collected information
To understand how good education is for learners from ethnic communities we gathered information in multiple ways:
- surveys of whānau (1,250 responses), made available in 10 languages
- surveys of learners (558 responses)
- surveys of teachers (263 responses)
- site visits at eight schools
- seven community hui/focus groups
- interviews with 11 community leaders or submitters
- online focus groups with school leaders from eight schools.
In our surveys, not everyone who responded to our surveys answered every question. The numbers we report are the proportions of those who answered each particular question.
Further details of the methods we used are in Appendix 1.
What type of diversity?
There are many forms of diversity including, among others, ethnic, cultural, language, identity, religious. For this project we focus on ethnic diversity and associated language, cultural, and religious diversity. ERO has already looked at some other forms of diversity separately, for example our work on education for disabled learners.
Throughout the report, ethnicity is defined as the ethnic groups that people identify with or feel they belong to. Ethnicity is a measure of cultural affiliation. It is not a measure of race, ancestry, nationality, or citizenship. Ethnicity is self-perceived, and people can belong to more than one ethnic group.3
Ethnic groups include first and second generation New Zealanders and subsequent generations as well as migrants and refugees, and those born overseas.
Terms used in this report
In this report, when we use the term “learners from ethnic communities” we are referring to learners who identify as African, Asian, Latin American, and Middle Eastern.
Data from StatsNZ about the population – past, present and projected – is grouped by age group. We use children aged 5-19 when thinking about changes in the school‑age learner population and refer to this group as “learners”.
We use “whānau” in reference to the extended family of these learners to acknowledge the importance of their close relationships and connections.
Which ethnicities?
Our research on the outcomes and experiences of learners from ethnic communities includes anyone who identifies their ethnicity as:
- African
- Asian
- Latin-American
- Middle-Eastern.
While we asked about experiences and outcomes for learners from Continental Europe, the small number of responses and data available means we are not able to report on these learners in this draft report.
People from ethnic communities in Aotearoa New Zealand are an incredibly diverse group, representing over 200 ethnicities and speaking over 170 languages.4
Māori and Pacific learners in this report
Focusing on the ethnic communities listed sits alongside our first and primary commitment to Te Tīriti o Waitangi, and ensuring tamariki and rangatahi Māori are strongly supported to learn and thrive in their culture, language, and identity.
This research complements ERO’s wide range of research and resources on good culturally responsive practice for Māori learners.
We included the experiences of Māori and Pacific learners who belong to multiple ethnic communities. We also drew on learnings from successful culturally responsive practices for Māori learners and Pacific communities and how they may help support a broader range of diverse learners.
What are the expectations for education?
Aotearoa New Zealand has strong expectations for education to respond to the needs of all learners. The New Zealand Curriculum sets out expectations for an inclusive and responsive curriculum. Schools and teachers are expected to deliver a curriculum that:
- reflects our linguistically and culturally diverse nation
- affirms learners’ different cultural identities
- incorporates learners’ cultural contexts into teaching and learning programmes
- is responsive to diversity within ethnic groups
- helps learners understand and respect diverse viewpoints, values, customs, and languages.
The Education and Training Act 2020 states that it is desirable, as far as is reasonably practicable, that every Board should reflect the ethnic and socio-economic diversity of the student body of the school or special institution.5
The Teaching Council is Aotearoa New Zealand’s professional body for teachers. The Code of Professional Responsibility and Standards for the Teaching Profession (Our Code | Our Standards)6 sets out the expectations for the teaching profession, including expectations for how they work with learners from ethnic communities and their whānau. Through the Code, teachers are obligated to:
- work in the best interests of learners by respecting the diversity of the heritage, language, identity, and culture of all learners
- respect the vital role learners’ families and whānau play in supporting their children’s learning by respecting the diversity of the heritage, language, identity and culture of families and whānau.7
The Standards expect teachers to:
- understand and acknowledge the histories, heritages, languages, and cultures of partners to Te Tīriti o Waitangi
- critically examine how [their] own assumptions and beliefs, including cultural beliefs, impact on practice and the achievement of learners with different abilities and needs, backgrounds, genders, identities, languages, and cultures
- create an environment where learners can be confident in their identities, languages, cultures, and abilities
- design learning based on curriculum and pedagogical knowledge, assessment information and an understanding of each learner’s strengths, interests, needs, identities, languages, and cultures
- design and plan culturally responsive, evidence-based approaches that reflect the local community and Te Tiriti o Waitangi partnership in New Zealand
- harness the rich capital that learners bring by providing culturally responsive and engaging contexts for learners.8
What does good look like?
Schools and societies around the world are becoming increasingly ethnically diverse. There are many different ways to think about what quality experiences and outcomes for learners from ethnic communities and their whānau look like.
We considered a variety of different frameworks when designing this work. In this report, we use the framework of the OECD.9 This framework sets out:
- Outcomes – for individuals, and equity and inclusion within the system.
- Outcomes – in society (for example labour market outcomes, or social outcomes)
We looked at four of their domains that influence the quality of those outcomes:
- Governing diversity, inclusion, and equity in education; including goals and expectations for teachers and schools.
- Developing capacity for managing diversity, inclusion, and equity in education; including awareness of diversity in education and teacher capability and capacity.
- Promoting school-level interventions to support diversity, inclusion and equity in education; including teaching practices, support for learners, and engagement with parents and communities.
- Monitoring and evaluating diversity, inclusion, and equity in education; including understanding progress.
The framework includes an additional domain on resourcing which is outside the scope of this project work. A diagram giving an overview of the framework is in Appendix 2.
Report structure
This report has five parts.
- Part 1 sets out how ethnic diversity is changing.
- Part 2 captures the educational experiences of learners from ethnic communities, including:
- learning and achievement
- cultural identity, belonging and inclusion, and wellbeing
- participation and engagement
- learning pathways and post-school destinations.
- Part 3 outlines how schools meet the needs of learners from ethnic communities and their whānau.
- Part 4 brings together the key findings from the evidence and their implications for the future.
- Part 5 sets out the next steps, including how to provide feedback on this draft report and when we expect to publish the final report.
This is a draft for consultation
At the end of each section, there is a box with some prompts for feedback. Think about your responses to these questions, and make a submission by Tuesday 20th December 2022.
Submitting your feedback
- Submit your feedback through the following link: https://www.surveymonkey.com/r/DraftLTIBSubmission
- Questions are available in the following languages: English, Arabic, Chinese (Simplified), Hindi, Japanese, Khmer, Korean, Spanish, Tagalog, Vietnamese.
- You do not have to answer all questions.
The closing date for submissions is Tuesday 20 December 2022.
Part 1: How is ethnic diversity in schools changing?
Ethnic diversity in Aotearoa New Zealand is increasing, and the proportion of learners from ethnic communities in our schools is growing. To think about what we need to do to support these learners, we need to understand ethnic diversity in Aotearoa New Zealand now, and what it will look like in the future.
In this section, we set out how ethnic diversity has changed in Aotearoa New Zealand schools, and how it will change in the future.
It is important to understand the diversity in our system so we can understand who is affected by different experiences, in what ways, and what outcomes they achieve. The OECD identified awareness of diversity in education at a system level as one of the main ways we can work to develop capacity for managing diversity, inclusion and equity in education.10
How we gathered information
To understand ethnic diversity in Aotearoa New Zealand schools and how it is changing, we used a variety of existing data. This included:
- census Population data
- Ministry of Education data
- StatsNZ data about projected ethnic diversity patterns
- data from international studies on education (studies we looked at include PISA, TIMMS, and PIRLS. These provide background knowledge on students’ learning to facilitate better education, specifically in terms of reading, mathematics, and science. They are global studies administered by the OECD).
This section describes:
- How diversity has changed in Aotearoa New Zealand.
- How diversity will change going forward.
What we found: an overview
Ethnic diversity has increased. The ethnic diversity of Aotearoa New Zealand’s population has grown over the last two decades. Diversity has also increased within ethnic groups, and our school-age population has become more diverse. These changes have not been limited to a specific region – they have happened throughout the country. In 2018, 14 percent of learners (aged five to 19 years) were Asian and nearly 2 percent were Middle Eastern, Latin American, and African (MELAA). In Auckland, 26 percent were Asian and over two percent were MELAA.
Ethnic diversity will continue to increase. In the next two decades, the ethnic diversity of learners aged five to 19 years will continue to increase, with the largest growth expected to be in the numbers of Asian learners. By 2043, it is expected just over one in four (26 percent) learners will identify as Asian and around one in 20 (3.6 percent) will identify as MELAA. In Auckland, more than two in five (43 percent) learners are expected to identify as Asian.11
How has diversity changed in Aotearoa New Zealand?
This section looks at:
- the changing population
- the changing population of learners
- differences between schools.
1. The changing population
Ethnic diversity is rapidly increasing
Aotearoa New Zealand’s ethnic diversity has grown quickly over the last two decades. For example, Census data from 2006 to 2018 shows Chinese, Indian, Filipino, Vietnamese, Japanese, Sri Lankan, Cambodian, and MELAA groups have all grown as a proportion of the country’s total population. Between 2006 and 2018, the Asian population has increased from 9.2 percent to 15.1 percent, while the MELAA population has grown from 0.9 percent to 1.5 percent (see Figure 1).12
Figure 1: Ethnicities in Aotearoa New Zealand's population: 2006 - 201813
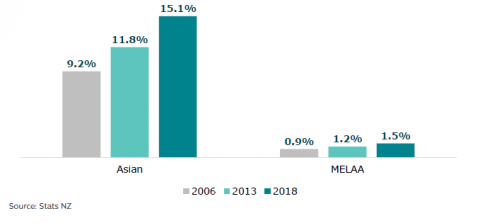
Figure one is a graph showing the population proportions of two ethnic groups (Asian and MELLA) of New Zealand’s total population, in 2006, 2013 and 2018. Asian population increased from 9.2% in 2006 to 11.8% in 2013 and then to 15.1% in 2018. MELLA population increased from 0.9% in 2006 to 1.2% in 2013, and to 1.5% in 2018.
Increasingly, people from ethnic communities are born in New Zealand
People from Asian and MELAA ethnic communities are increasingly born in Aotearoa New Zealand. In 2006, 20 percent of the Asian population was born in Aotearoa New Zealand. This increased to 23 percent by 2018. Similarly, 19 percent of the MELAA population was born in Aotearoa New Zealand in 2006, increasing to 23 percent by 2018.14
Ethnic communities are changing
Diversity has also changed within these ethnic groups. For example, within the Asian ethnic group in Aotearoa New Zealand, the number of people identifying as Indian and Filipino increased rapidly between 2006 and 2018. The proportion of Indian people grew from 30 percent of the Asian population to 34 percent. The proportion of people identifying as Filipino increased from 5 percent to 10 percent of the Asian population (see Figure 2).
Figure 2: Proportion of ethnicities within the Asian ethnic group: 2006-201815
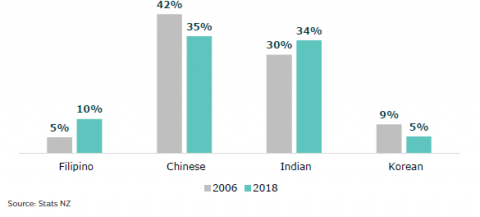
Figure two is a graph showing the proportion of the population of different ethnicities (Filipino, Chinese, Indian and Korean) among the total Asian population in 2006 and 2018. The proportion of Filipino increased from 5% in 2006 to 10% in 2018. Chinese population decreased from 42% in 2006 to 35% in 2018. Indian population increased from 30% in 2006 to 34% in 2018. Korean population decreased from 9% in 2006 to 5% in 2018.
We can also see change within the MELAA group in Aotearoa New Zealand. Middle Eastern people were 40 percent of the MELAA population in 2018, decreasing from 50 percent in 2006. African people also decreased from 31 percent in 2006 to 24 percent in 2018. However, Latin American people increased from 19 to 37 percent of the MELAA group from 2006-2018 (see Figure 3).
Figure 3: Proportion of ethnicities within the MELAA ethnic group: 2006-201816
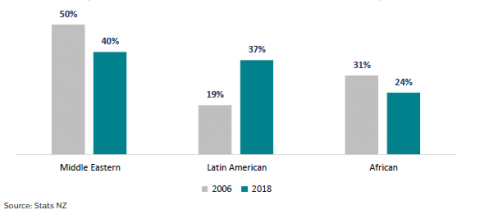
Figure three is a graph showing the proportion of the population of different ethnicities (Middle Eastern, Latin American, and African) among the total MELLA population in 2006 and 2018. The proportion of Middle Eastern decreased from 50% in 2006 to 40% in 2018. Latin American increased from 19% in 2006 to 37% in 2018. African population decreased from 31% in 2006 to 24% in 2018.
There has been rapid growth in the number of speakers of languages other than English
Since 2006, the number of people who are speakers of languages other than English in Aotearoa New Zealand has steadily increased. For example, the number of Northern Chinese speakers has more than doubled between 2006 and 2018, while Tagalog speakers have more than tripled. Figure 4 shows a selection of the five most common languages in Aotearoa New Zealand, and the increase in numbers of speakers of those languages over time.
Tagalog is a second language for the majority of people in the Philippines. Yue is spoken in Southern China. Hindi is spoken in parts of Northern, Central, Eastern and Western India.
Figure 4: Number of Aotearoa New Zealand residents who speak languages other than English: 2006-201817
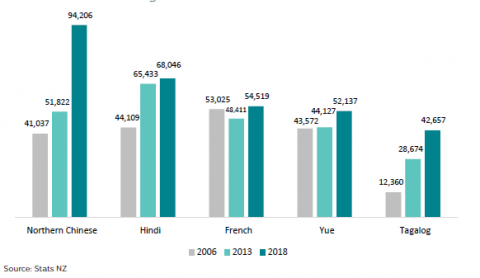
Figure four is a graph showing the number of residents who speaks the following five most common non-English languages (Tagalog, Yue, French, Hindi and Northern Chinese) in 2006, 2013 and 2018.
The number of Tagalog speakers were 12,360 in 2006, 28,674 in 2013 and 42, 657 in 2018.
Yue speakers increased from 43, 572 in 2006 to 44, 127 in 2013 and 52, 137 in 2018.
The number of French speakers were 53,025, 48,411 and 54,519 in 2006, 2013 and 2018.
The numbers of Hindi speakers were 44,109, 65, 433 and 68,046 in 2006, 2013 and 2018. The number of Northern Chinese speakers were 41, 037, 51,822 and 94, 206 in 2006, 2013 and 2018.
2. The changing population of learners
Ethnic diversity is increasing in Aotearoa New Zealand schools.
In 2018, 14 percent of learners were Asian, up from 6 percent in 1996. The percent who identified as MELAA is now 2 percent and has tripled since 1996. Change is happening across the country. In Auckland, the Asian population of learners has increased from 13 to 26 percent. In Southland, the proportion of Asian learners has grown from 1 to 6 percent (see Figures 5 and 6 - regional projections are not available for MELAA populations).
Figure 5: Proportion of learners in Auckland who identify as Asian: 199618 and 201819
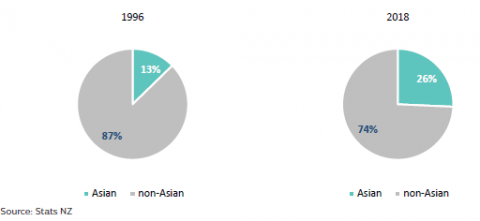
Figure five is a graph showing the proportion of Asian learners’ population in Auckland in 1996 and 2018. 13% learners were Asians in Auckland in 1996, and the number went up to 26% in 2018.
Figure 6: Proportion of learners in Southland who identify as Asian: 199620 and 201821
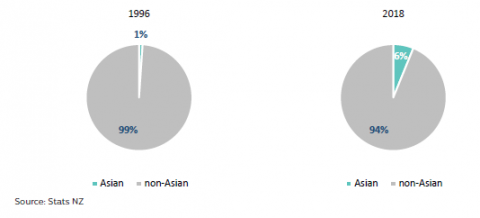
Figure six is a graph showing the proportion of Asian learners’ population in Southland in 1996 and 2018. In 1996, 1 % learners in Southland were Asian, and 6% learners were Asian in 2018.
Increasingly, children from ethnic communities are born in New Zealand
The number of children from ethnic communities born in Aotearoa New Zealand is growing.
In 2006, 59 percent of zero to 14 year olds of Asian ethnicity were born in Aotearoa New Zealand. By 2018 this had increased to 72 percent, to a total of 103,635. The trend is similar for MELAA children. In 2006, 49 percent were born in Aotearoa New Zealand. By 2018 this had increased to 67 percent, to a total of 11,619.22
Migration patterns impact the numbers of children from ethnic communities born in Aotearoa New Zealand over time. Although we see a trend towards an increase from 2006-2018, the numbers of people from Asian and MELAA ethnic communities born in New Zealand could continue to increase or decline, depending on future migration patterns.
More learners speaking languages other than English
Increasing ethnic diversity is leading to an increase in the number of learners of languages other than English at home. For example, 30 percent of Year 5 Asian learners speak English at home, compared to 69 percent of all Year 5 learners.23
Increasingly, learners have multiple ethnicities
Many learners identify with more than one ethnic group. For example, around 133,800 children aged from five to 19 years old were identified as Asian in the 2018 Census. Within this group, about 28,185 (21 percent) were reported as identifying with more than one ethnic group. This has increased since 2006 when 16 percent of Asian youth identified as more than one ethnic group.24
In the MELAA population there is a greater rate of multiple ethnicities. In 2006, 24 percent of MELAA youth (aged 5-19 years) were identified with more than one ethnicity. In 2018, this had grown to 37 percent.25
3. Differences between schools
Some ethnicities are more likely to attend high decile schools
Changing diversity looks different for different schools. For example, ethnic distribution varies across school deciles. Low decile schools serve poorer communities, and high decile schools serve richer communities. In 2021, Indian, South-East Asian, and Middle Eastern learners were evenly spread across deciles nationally, but Chinese, Latin American, African, and Other Asian learners mostly attended high decile schools (see Figure 7).
Low decile refers to deciles 1, 2 and 3. Middle decile refers to deciles 4, 5, 6 and 7. High decile refers to deciles 8, 9 and 10.
Figure 7: Ethnicity spread across school decile groups: 2021
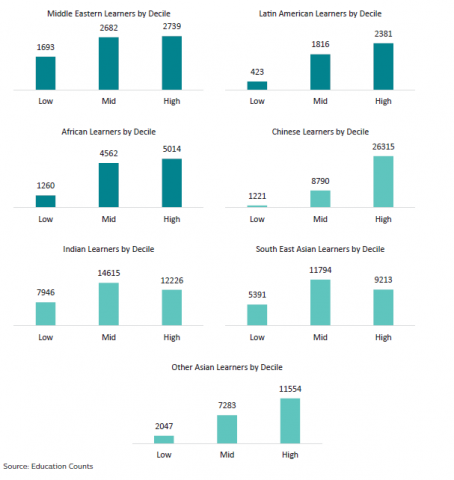
Figure seven is a graph showing the number of students in the following ethnic groups attending schools across the following three decile groups.
1693, 2682 and 2739 middle eastern learners were in low, mid and high decile schools.
423, 1816 and 2381 Latin American learners were in low, mid and high decile schools.
1260,4562 and 5014 African learners were in low, mid and high decile schools.
1221, 8790 and 26315 Chinese learners were in low, mid and high decile schools.
7946, 14615 and 12226 Indian learners were in low, mid and high decile schools.
5391, 11794 and 9213 South east Asian learners were in low, mid and high decile schools.
2047, 7283 and 11554 Other Asian learners were in low, mid and high decile schools.
Learners from ethnic communities are more likely to be in urban schools
Most learners from ethnic communities go to schools located in urban areas. For example, 99 percent of Chinese and Indian learners go to schools in urban areas, compared to 92 percent in the average New Zealand population. South‑East Asian (3 percent), African (5 percent), and Latin American (6 percent) learners are more likely to go to schools in rural areas compared to Chinese (1 percent), Indian (1 percent), and Middle Eastern (1 percent) learners.
How will diversity change going forward?
This section shares:
- how the population will change
- how the population of learners will change.
We have used StatsNZ’s population projections. As the future is far from certain these projections include ranges. We have used the medium projection of these ranges. Appendix 3 has more detail on these projections.
1. How the population will change
By 2043, 24 percent of our population is expected to identify as Asian26 – this is likely to be 44 percent in Auckland.27
Aotearoa New Zealand’s population is expected to continue to become more ethnically diverse over the next two decades.
By 2043, we expect the Asian population to grow to 24 percent of our population, up from 15 percent in 2018.
By 2043, we expect the Asian population to grow to 44 percent of Auckland’s population, increasing from 28 percent in 2018.28 But this growth is not just in Auckland, for example, in the Southland region, the Asian population is expected to increase from 6 to 19 percent.29
The MELAA population of Aotearoa New Zealand will also increase. Between 2018 and 2043 we expect the MELAA ethnic community to increase from 1.5 to almost 3 percent of the population.30
2. How the population of learners will change
By 2043, 26 percent of learners are expected to identify as Asian, and 4 percent MELAA. In Auckland, 43 percent are expected to identify as Asian.
MELAA and Asian populations are expected to grow quickly in schools. The Asian learner population is projected to increase from 14 percent in 2018, to 26 percent by 2043. The population of MELAA learners is projected to more than double, from 1.7 to 3.6 percent (see Figure 8).31
Figure 8: Proportion of learners in Aotearoa New Zealand who identify as MELAA or Asian
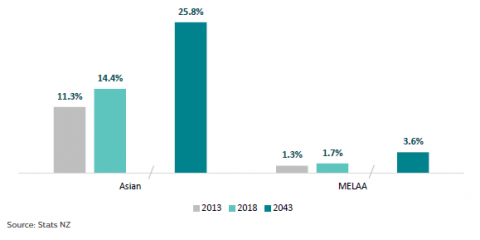
Figure eight is a graph showing the proportion of learners who identify as MELAA or Asian in 2013, 2018 and 2043.
The proportion of Asian learners were 11.3% and 14.1% in 2013 and 2018. The figure will go up to 25.8% in 2043.
The proportion of MELAA learners were 1.3% and 1.7% in 2013 and 2018. The figure will go up to 3.6% in 2043.
The Asian population in schools is expected to increase across the country. The proportion of learners in Auckland who identify as Asian is expected to increase from 26 percent in 2018, to 43 percent by 2043 (see Figure 9). We will also see this growth regionally:
- Waikato, from 9 percent in 2018 to 21 percent by 2043
- Bay of Plenty, from 7 percent in 2018 to 19 percent by 2043
- Wellington, from 13 percent in 2018 to 28 percent by 2043
- Nelson, from 9 percent in 2018 to 24 percent by 2043
- Canterbury, from 11 percent in 2018 to 24 percent by 2043
- Southland, from 6 percent in 2018 to 19 percent by 2043 (see Figure 10).
Figure 9: Proportion of learners in Auckland who identify as Asian: 201832 and 204333
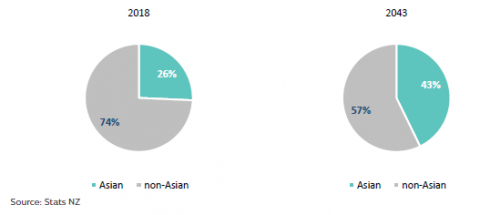
Figure 9 is a graph showing the proportion of learners who identified themselves as Asian in Auckland in 2018 and are projected to identify themselves as Asian in Auckland in 2043. 26% learners identified themselves as Asian in 2018 and 43% learners are projected to identify themselves as Asian in 2043.
Figure 10: Proportion of learners in Southland who identify as Asian: 201834 and 204335
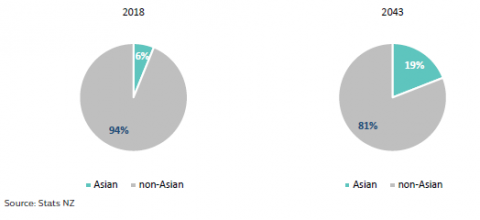
Figure 10 is a graph showing the proportion of learners who identified themselves as Asian in Southland in 2018 and are projected to identify themselves as Asian in Auckland in 2043. 6% learners identified themselves as Asian in 2018 and 19% learners are projected to identify themselves as Asian in 2043.
Changes to individual school rolls
Changes at a regional level will affect the diversity of individual school rolls in different ways. Some schools will likely see a large increase in the numbers of learners from ethnic communities. For some schools, the increase may be small numbers from a wider range of ethnicities. For others, the increase may be from one or two ethnic communities. This may look different for neighbouring schools.
More information about these StatsNZ projections can be found in Appendix 3.
Conclusion
Ethnic diversity in Aotearoa New Zealand has increased and is expected to keep increasing. The number of learners from ethnic communities is increasing and by 2043, more than one in four learners will identify as Asian, and around one in 20 will identify as MELAA. They will increasingly speak languages other than English. Increased ethnic diversity will occur in all regions in Aotearoa New Zealand.
Feedback prompts
- How well do you relate to the findings in this section?
- What sits well with you?
- What is surprising?
- What is missing from this story?
- What are the implications?
Part 2: What are the educational experiences of learners from ethnic communities and their whānau?
Education is critical for all children and young people’s futures. Like other learners, learners from ethnic communities and their whānau want a variety of experiences and outcomes from their education so they can make friends, develop skills for life, and find pathways to careers.
This section describes their experiences in Aotearoa New Zealand schools, and their transition from schooling to further education or the workforce. It finds that, although learners from ethnic communities have strong cultural identities and perform well at school, they face discrimination and racism that damages their sense of belonging, wellbeing, and access to future pathways.
How we gathered information
To understand the educational experiences and outcomes of learners from ethnic communities, we asked them and their whānau about their experiences at school. In both an online survey and through focus groups, we asked questions about their:
- learning and achievement
- cultural identity, belonging and inclusion, and wellbeing
- participation and engagement
- destinations and pathways.
More detail about the survey and focus groups can be found in Appendix 1.
We also looked at:
- data on learning, progress, and achievement for learners from ethnic communities
- data about attendance, participation, and engagement
- data about what learners from ethnic communities do when they leave school
- Ministry of Social Development’s What About Me? survey (2021).
This section describes
The OECD framework breaks outcomes into four areas:
- Individual wellbeing
- Equity and inclusion within the education system
- Individual outcomes
- Cohesion and inclusion in society
This section focuses on:
- learning and achievement – learners’ academic outcomes
- cultural identity, belonging and inclusion, and wellbeing – their psychological and social outcomes
- participation and engagement – learners’ inclusion in the education system
- destinations and learning pathways – their potential for labour market outcomes.
Across all these areas, we looked at where there is inequity based on learners’ and their whānau ethnicity.
What we found: an overview
Many, but not all, learners from ethnic communities achieve well in education. Looking at NCEA Level 2 results, Filipino, Indian, Japanese, Vietnamese, and Korean learners all achieve above the national average. However, there are significant differences across ethnic communities, and within all ethnic communities there are learners who are not achieving well.
Learners from ethnic communities often do not feel they belong. Nearly one in five learners reported they frequently feel they do not belong and a third feel lonely at school. Nearly one in five also feel they have to hide their ethnic identity at school or feel excluded from activities because of their ethnic identity.
Learners from ethnic communities experience widespread racist bullying, which too often is not taken seriously by their school. One in five learners have experienced racist bullying in the last month, and over half have seen others being bullied because of their ethnicity. Both whānau and learners report that racist bullying needs to be better identified and addressed at school.
Whānau from ethnic communities face barriers to engaging with schools. They attend parent information meetings more than any other activity but find information about their children’s learning insufficient or confusing. They are significantly under-represented on School Boards.
Many learners from ethnic communities go on to tertiary study, but pathways are confusing, and, for some, choices are unfairly constrained by teachers’ biases. More than one in four secondary learners report that teachers’ recommendations for their course selection are influenced by ethnicity and only half of secondary learners are fully happy with their subject choices. Many learners and whānau find NCEA confusing. NCEA is the National Certificate of Educational Achievement. For more information on NCEA, and how students achieve this, please visit National Certificate of Educational Achievement (NCEA) » NZQA
1. Learning and achievement
Learning and achievement in Aotearoa New Zealand schools is measured and reported in many ways. In primary schools, teachers and leaders choose how to measure and report learners’ progress and achievement. This information is not collected at a national level.
In secondary schools, learners can show their learning and achievement through the national qualification – NCEA. NCEA is offered at Levels 1, 2 and 3, which broadly line up with learners in Years 11, 12 and 13. Learners’ achievement is graded as either Not Achieved, Achieved, Achieved with Merit or Achieved with Excellence. They can choose credits and courses that suit them and their desired educational pathway. Learners may also gain University Entrance, which demonstrates they have the knowledge and skills required to enrol in first year studies at university.
In this section different ethnic groups (e.g. Asian, MELAA etc.) are examined alongside the overall New Zealand results. Learners from Ethnic Communities are included in the New Zealand results and therefore while the New Zealand results provide a point of reference, a direct comparison should not be made. An overview of NCEA overview can be found at https://www.nzqa.govt.nz/ncea/understanding-ncea/how-ncea-works/.
We can also understand Aotearoa New Zealand secondary learners’ achievement through international measures. In this report we use learners’ achievement in PISA, which measures 15 year olds’ achievement.
In this section we set out:
- Areas that are stronger:
- Higher NCEA achievement for most
- Higher endorsements
- Higher University Entrance
- Better achievement on international measures, particularly for Chinese learners
- Possible areas of concern:
- Lower NCEA achievement for some
- Greater gender gaps for Indian, African, and Middle Eastern learners
- Not being challenged at school
Areas that are stronger
Higher NCEA achievement for most
Learners from ethnic communities achieve well compared to others. Eighty one percent of Asian Year 12 learners achieve NCEA Level 2 compared with the New Zealand average at 78 percent. MELAA learners achieve at an equal rate to New Zealand learners overall, as shown in Figure 11.
Figure 11: NCEA Level 2 attainment, by ethnicity: 2021
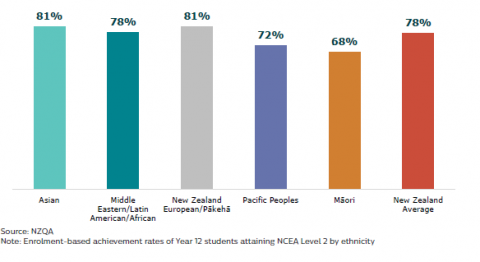
Figure 11 is a graph showing the Cumulative NCEA level 2 attainment rates for learners from the following ethnic groups in 2021. The attainment rates for Asian and New Zealand European was the highest at 81%, while the attainment rate for MELAA was 78%. The rate for Pacific peoples and Māori were 72% and 68% respectively. New Zealand average attainment rate was 78%.
Within the Asian group, we can see many ethnicities achieve more than the Aotearoa New Zealand average (see Figure 12).
Figure 12: NCEA Level 2 attainment, by Asian ethnicities (selected): 2021
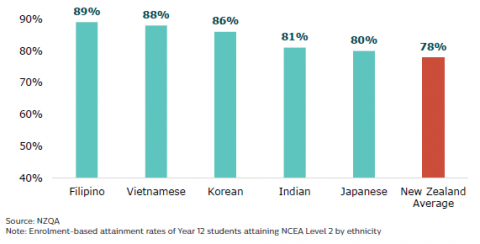
Figure 12 is a graph showing the Cumulative NCEA level 2 attainment rates for learners from the following selected Asian ethnic groups in 2021. Filipino had the highest attainment rate at 89%. Vietnamese and Korean’s attainment rate were 88% and 86%. Indian’s attainment rate was 81%, while Japanese’s attainment rate was 80%. New Zealand average attainment rate was 78%.
Higher endorsements
Learners from ethnic communities achieve Merit and Excellence endorsements at a high
rate – 58 percent of Asian learners and 43 percent of MELAA learners achieve these endorsements at Level 2 compared to 42 percent of Aotearoa New Zealand learners as a whole (see Figure 13).
Figure 13: NCEA Level 2 Merit and Excellence endorsements, by ethnicity: 2021

Figure 13 is a graph showing Level 2 Merit and Excellence endorsement rates for learners from the following ethnic groups in 2021.
Asian had the highest Merit endorsement rate at 29%, and it had the highest Excellence endorsement rate at 29%.
MELAA’s Merit endorsement rate was 26% and its Excellence rate was 17%.
New Zealand European’s Merit endorsement rate was 25% and its Excellence endorsement rate was 19%.
The Merit endorsement rate for Maori was 16% and the excellent endorsement rate for Maori was 8%.
The Merit endorsement rate for Pacific people was 18% and the excellent endorsement rate was 7%.
New Zealand Average Merit endorsement rate was 24% and the average excellence endorsement rate was 18%.
Higher University Entrance
Many learners from ethnic communities are well-placed to attend university. Figure 14 below shows that 63 percent of Asian learners and 56 percent of MELAA learners achieve University Entrance compared with the New Zealand average at 52 percent.
Figure 14: University Entrance attainment, by ethnicity: 2021
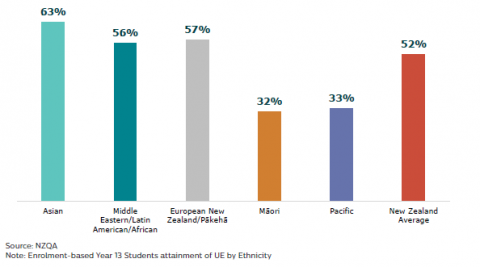
Figure 14 is a graph showing University Entrance (UE) attainment rates for learners from the following ethnic groups in 2021.
Asian had the highest UE attainment rate at 63%, this is followed by European New Zealanders at 57%. The rate for MELLA was 56%, and the rates for Maori and Pacific people were 32% and 33% respectively.
The New Zealand average rate was 52%.
Within the Asian group, many ethnicities achieve University Entrance at a higher rate than the national average, as seen in Figure 15 below, with Koreans achieving at the highest rate (76 percent).
Figure 15: University Entrance attainment, by Asian ethnicities (selected): 2021
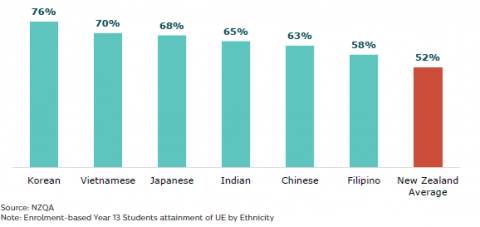
Figure 15 is a graph showing University Entrance (UE) attainment rates for learners from the following Asian ethnic groups in 2021. Koran had the highest UE attainment rate at 76%. This was followed by Vietnamese’s UE attainment rate at 70%.
The rates for Japanese, Indian and Chinese were all 68%, 65% and 63% respectively. The rate for Filipino were 58%. The New Zealand average rate was 52%.
Middle Eastern, African and Latin American learners also achieve University Entrance above the New Zealand average (see Figure 16).
Figure 16: University Entrance attainment, by MELAA ethnicities: 2021
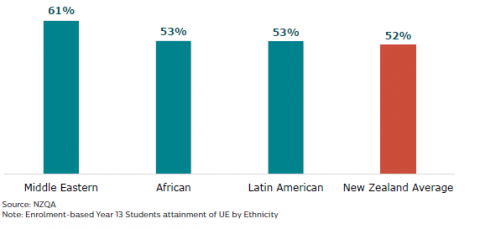
Figure 16 is a graph showing University Entrance (UE) attainment rates for learners from the following MELLA ethnic groups in 2021. Middle Eastern learners had the highest UE attainment rate at 61%. The UE attainment rates for Africans and Latin Americans were both 53%. The New Zealand average rate was 52%.
Better achievement on international measures, particularly for Chinese learners
Asian learners also achieve well on international measures. This is largely driven by Chinese learners’ achievement, where a large proportion of Chinese learners achieve at the highest levels (see Figure 17). Achievement on PISA for MELAA learners was not able to be reported due to small numbers. In this section different ethnic groups are examined alongside the overall New Zealand results. Learners from ethnic communities are included in the New Zealand results and therefore while the New Zealand results provide a point of reference, a direct comparison should not be made.
Figure 17: PISA Mathematics achievement of Asian learners, by sub-ethnicity: 2018

Figure 17 is a graph showing the PISA Mathematics achievement of Asian learners from different sub-ethnic groups.
22% New Zealanders achieved below level 2, 23% new Zealanders achieved level 2.
25% new Zealanders achieved level 3.
19% new Zealanders achieved level 4.
12% new Zealanders achieved level 5 or above.
11% Chinese achieved below level 2.
12% Chinese achieved level 2.
19% Chinese achieved level 3.
22% Chinese achieved level 4.
36% Chinese achieved level 5.
15% Filipino achieved below level 2.
23% Filipino achieved level 2.
29% Filipino achieved level 3.
22% Filipino achieved level 4.
9% Filipino achieved level 5.
21% Indian achieved below level 2.
22% Indian achieved level 2.
27% Indian achieved level 3.
20% Indian achieved level 4.
10% Indian achieved level 5.
Possible areas of concern
High achievement is not universal across learners. Within all ethnic groups, there are learners who are not achieving as well overall, or across the breadth of the curriculum.
Lower NCEA achievement for some
Not all learners from ethnic communities achieve well at NCEA 2. Chinese, Middle Eastern, and Latin American learners achieve slightly lower than the Aotearoa New Zealand average (see Figure 18).
Figure 18: NCEA Level 2 attainment by Chinese, Middle Eastern and Latin American: 2021
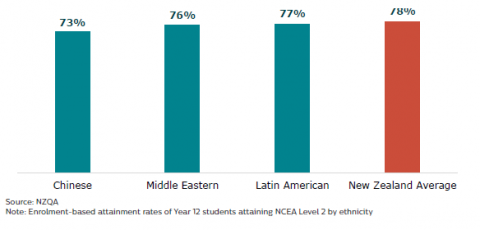
Figure 18 is a graph showing the NCEA Level 2 attainment rates of Chinese, Middle Eastern and Latin American learners in 2021.
The rate for Chinese learners was 73%.
The rate for Middle eastern learners was 76%.
The rate for Latin American learners was 77%.
The New Zealand average rate was 78%.
The picture for NCEA 2 achievement is a complex one as, although Chinese and Middle Eastern learners achieve below the New Zealand average for NCEA 2, they are more likely than the
New Zealand average to achieve University Entrance.
Greater gender gap for Indian, African, and Middle Eastern
For Indian, African, and Middle Eastern learners, the percentage point gap between male and female achievement of University Entrance is larger than the New Zealand average, as shown in Figure 19. For Chinese and Latin American learners, the gap between male and female achievement is similar to the New Zealand average but is still concerning.
Achieving University Entrance is a pre-requisite for many future destinations and pathways, so large gaps between male and female learners are concerning.
Figure 19: Achievement gap between male (lower achievement) and female (higher achievement) learners by ethnicity for University Entrance (selected): 2021
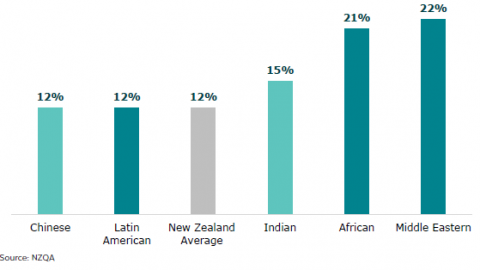
Figure 19 is a graph showing the achievement gap between male (with lower achievement) and female (with higher achievement) learners by ethnicity for University Entrance in 2021.
The gap between Chinese male and female learners was 12%.
The gap between Latin American male and female learners was 12%.
The average gap between New Zealand male and female learners was 12%.
The gap between Indian male and female learners was 15%.
The gap between African male and female learners was 21%.
The gap between Middle Eastern male and female learners was 22%.
Not being challenged at school
It is important that learning is at the right level to ensure learners progress. Forty percent of whānau from ethnic communities think their child’s schoolwork is easy or very easy, and 29 percent of learners from ethnic communities think this (see Figure 20).
Figure 20: Parent/whānau and learner agreement their schoolwork is at the right level of difficulty
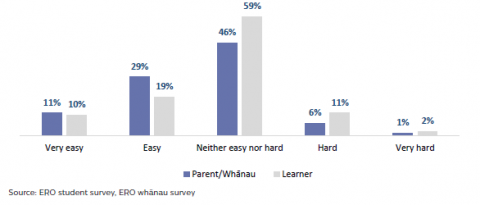
Figure 20 is a graph showing how learners and parents from ethnic groups feel about the level of difficulty of their schoolwork.
11% parents from ethnic groups feel the schoolwork is very easy, and 29% parents feel the schoolwork is easy. 46% parents feel the schoolwork is neither easy nor hard. 6% parents feel the schoolwork is hard, and 1% parents feel the schoolwork is very hard.
10% learners from ethnic groups feel the schoolwork is very easy and 19% learners feel the schoolwork is easy.
59% learners feel the schoolwork is neither easy nor hard.
11% learners feel the schoolwork is hard and 2% learners feel the schoolwork is very hard.
Learners and whānau from ethnic communities lack information about how well they are learning and progressing. Over a third (36 percent) of learners are rarely or almost never told how well they are doing or what they are good at (see Figure 21).
School reports are very complicated. Migrant parents need extra help understanding them.
– Parent
This may contribute to concerns about their child’s level of academic achievement or challenge at school. Whānau from ethnic communities are particularly concerned when their child is not achieving, and teachers have not communicated this to them.
Figure 21: How frequently learners are told how well they are doing and what they are good at

Figure 21 is a graph showing how often learners from ethnic communities identified that in the last 30 days, their teachers told them what they are good at, and how often learners from ethnic communities identified that in the last 30 days, their teacher told them how well their learning is going?
9% learners identified their teachers never or almost never told them how good they were good at in the last 30 days.
27% learners identified their teachers told them how good they were good at once or twice a month in the last 30 days.
35% learners identified their teachers told them how good they were good at once or twice a week in the last 30 days.
18% learners identified their teachers told them how good they were good at every day or almost every day in the last 30 days.
10% learners identified they don’t know about it.
8% learners identified their teachers never or almost never told them how well their learning is going in the last 30 days.
28% learners identified their teachers told them how well their learning is going once or twice a month in the last 30 days.
38% learners identified their teachers told them how well their learning is going once or twice a week in the last 30 days.
20% learners identified their teachers told them how well their learning is going every day or almost every day in the last 30 days.
7% learners identified they don’t know about it.
2. Cultural identity, belonging and inclusion, and wellbeing
Maintaining family traditions and cultural heritage, cultural values and religious beliefs are more important for learners from ethnic communities compared with their European peers.36
To understand how well learners from ethnic communities are supported in their cultural identity, belonging and inclusion, and wellbeing, we asked them and their whānau about their experiences of school. We also looked at data from other sources to get a deeper understanding of the experiences of these learners.
In this section we set out:
- Areas that are stronger:
- Positive cultural identity
- Celebrating and respecting cultures
- Possible areas of concern:
- Widespread racism
- Not being accepted and not belonging
- … Particularly for MELAA
- Lack of cultural understanding
- Mismatch of values and practices
- Lack of recognition and support
- Poor wellbeing for MELAA
Areas that are stronger
Many learners and their whānau from ethnic communities have strong cultural identities and often feel included by their school communities.
Positive cultural identity
Many learners and whānau report positive feelings about their ethnic identity or culture at school. Almost four out of five whānau feel their child is proud of their ethnic identity or culture, whilst 64 percent of learners reported feeling proud at least once or twice a week. Most (74 percent) learners never or mostly never feel they have to hide their ethnic identity or culture at school, or that this aspect of their identity is a barrier to joining in some school activities (75 percent) (see Figure 22).
Figure 22: How often learners have to hide their ethnicity, or ethnicity is a barrier to participation
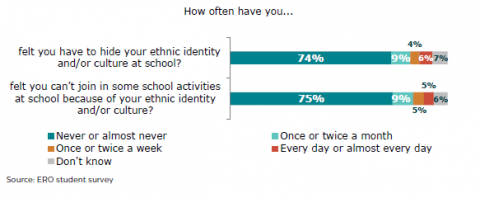
Figure 22 is a graph showing how often learners felt they have to hide their ethnic identity and, or culture at school, and how often learners felt they cannot join in some school activities at school because of their ethnic identity and, or culture?
74% learners identified they never or almost never felt they have to hide their ethnic identity and, or culture at school.
9% learners identified they have to hide their ethnic identity and, or culture at school once or twice a month.
4% learners identified they have to hide their ethnic identity and, or culture at school once or twice a week.
6% learners identified they have to hide their ethnic identity and, or culture at school every day or almost every day.
7% learners identified they don’t know.
75% learners identified they never or almost never felt they cannot join in some school activities at school because of their ethnic identity and, or culture.
9% learners identified they felt they cannot join in some school activities at school because of their ethnic identity and, or culture once or twice a month.
5% learners identified they felt they cannot join in some school activities at school because of their ethnic identity and, or culture once or twice a week.
5% learners identified they felt they cannot join in some school activities at school every day or almost every day.
6% identified they don’t know.
The What About Me? Survey results show that Asian learners feel more strongly than European learners that their identity and values are considered (see Figure 23).
Figure 23: How strongly ethnicities feel their identity and values are considered by teachers (scored 0-10/disagree to agree)
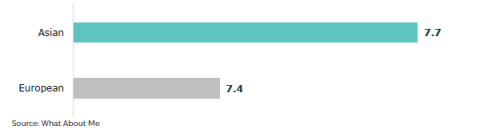
Figure 23 is a graph showing the mean scores of agreement level for learners in the following ethnic groups (Asian and European) feel their identity and values are considered by teachers.
The mean score of Asians was 7.7 out of 10.
The mean score of Europeans was 7.4 out of 10.
In focus groups, learners told us their sense of cultural identity was supported when:
- their cultural identity is visible in the environment and included in school practices,
they get to participate in cultural events and activities - they can speak or learn their first language and heritage.
It’s easy to be myself here.
– Learner
Celebrating and respecting cultures
In our survey, the majority (54 percent) of learners agreed their school celebrates their culture (see Figure 24).
Figure 24: Schools celebrate culture – learner responses
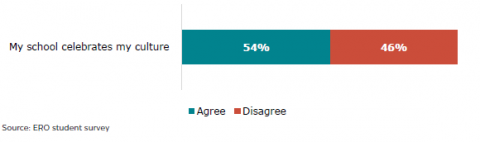
Figure 24 is a graph showing the responses of learners from ethnic groups regarding to their school celebrating their culture.
54% learners agreed their school celebrated their culture while 46% disagreed with this
Whānau were more positive, with nearly three quarters saying their child’s school celebrates their culture (see Figure 25).
Figure 25: Schools celebrate culture – parent/whānau responses
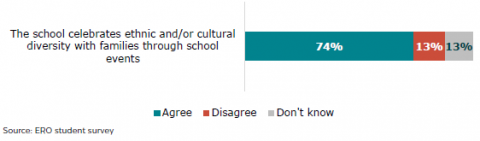
Figure 25 is a graph showing the responses of whānau or parents from ethnic groups regarding to ‘The school celebrates ethnic and/ or cultural diversity with families through school events.’
74% whānau agreed their school celebrates ethnic and, or cultural diversity with families through school events. 13% whānau disagreed with this, and 13% whānau don’t know.
Whānau and learners are appreciative of these efforts by the school. Such cultural events acknowledge and recognize their culture which makes them feel valued and welcomed.
Most whānau (74 percent) also reported their child’s ethnic identity is often or always respected, and 55 percent of learners feel this way at least once or twice a week. Seventy-six percent of learners also told us their teachers know about cultural practices that are important to them.
The What About Me? survey asked about how fairly learners are treated by their teachers, and results were generally positive. Asian learners agreed most strongly (7.9/10) that they are treated fairly, compared to their European peers at 7.4/10. This was supported by our survey which found 80 percent of learners did not think they were treated unfairly.
Whānau also feel positive about their cultural identity when it comes to engaging with their child’s school – more than eight out of 10 said their identity is not a barrier to joining in cultural activities, or a factor in how fairly they are treated by the school (see Figure 26).
Figure 26: Parents/whānau agreement they cannot join in with school activities, or have been treated unfairly because of their ethnic identity and/or culture

Figure 26 is a graph showing whether whānau from ethnic groups agreed with the two statements ‘I have been treated unfairly at my child’s school because of my ethnic identity or culture.’ and ‘I feel I can’t join in school activities because of my ethnic identity and/ or culture.’
84% whānau disagreed with ‘I have been treated unfairly at my child’s school because of my ethnic identity or culture.’ 11% agreed with this and 5% don’t know.
89% whānau disagreed with ‘I feel I can’t join in school activities because of my ethnic identity and/ or culture.’ 8% agreed with this and 3% don’t know.
In our focus groups and interviews, whānau told us they appreciated when:
- schools have a family-like atmosphere
- schools worked to make community networks strong
- school staff are approachable
- a diversity of cultures is visible at their child’s school.
In our community hui, whānau described inclusive practices in their school which included food and religious practices. Some schools were also more flexible with uniforms to accommodate the needs of different ethnic communities. Members of the community found that some schools took a strength-based approach to diversity.
They recognise ethnic diversity. And it helps children live in school without being uncomfortable.
– Parent of a Year 13 learner
Possible areas of concern
Sadly, learners and their whānau report too many examples where their ethnicity or culture is not accepted or respected and their sense of belonging is negatively affected. Many of these reflect widespread instances of racism which have measurable impacts on the wellbeing of learners and their whānau.37
Widespread racism
International and Aotearoa New Zealand research into the impacts of racism on children highlight the wide range of impacts racism can have. Racism negatively affects children and young people’s:
- academic achievement, and contributes to the achievement gap between different ethnic groups38
- physical wellbeing, including increased likelihood of illness and impaired cognitive development39
- health-related behaviours, such as smoking and binge drinking40
- psychological wellbeing, increasing experiences of anxiety, depression, distress, and low resilience41
- quality of life, reducing levels of happiness, self-esteem, and self-worth.42
These impacts occur both when children experience racism themselves, or witness it occurring to others, such as their peers and/or whānau (known as vicarious racism). Because the harms associated with racism are so impactful it is incredibly important incidents are taken seriously as racism is often under-reported.43
Levels of racism and racist bullying are unacceptably high and are of key concerns for families and learners in our survey (see Figure 27). Learners reported high levels of racist bullying within the last month:
- more than half (54 percent) of learners reported seeing someone being mean to others because of their ethnic identity and/or culture
- one in five (22 percent) have experienced someone making fun of their ethnicity, culture or language
- one in five (20 percent) have been bullied because of their ethnic identity and/or culture
- one in five (19 percent) have read racist messages.
Figure 27: Learners’ experiences of racist bullying and racism
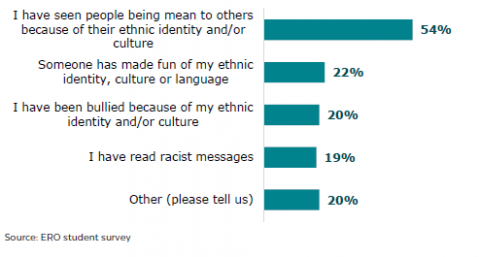
Figure 27 is a graph showing the percentage of learners who reported the following things happened to them at school in the last 30 days of school.
54% reported ‘I have seen people being mean to others because of their ethnic identity and or culture.’
22% reported ‘someone has made fun of my ethnic identity, culture or language.
20% reported ‘I have been bullied because of my ethnic identity and or culture.’
19% reported ‘I have read racist messages.’
20% reported ‘other’.
Learners that told us about other kinds of ethnic bullying and racism that have happened to them in the last month. They described incidents of microaggressions and stereotyping.44
Microaggressions are brief, everyday interactions – spoken or actions – that communicate biases and negative thoughts and feelings about someone’s ethnicity and can have significant impacts on people’s wellbeing.
When looking at learner experiences, just under half (45 percent) of those students who reported an instance of racism in the last month had experienced more than one racist incident. More than one in five (23 percent) have experienced an instance of racism more than three times in the past month.
One in four learners reported their teacher has treated them unfairly due to their ethnicity in the past year. Learners from ethnic communities experience this significantly (see Figure 28).
Figure 28: Likelihood of being treated unfairly by a teacher due to their (students’) ethnicity in the last 12 months
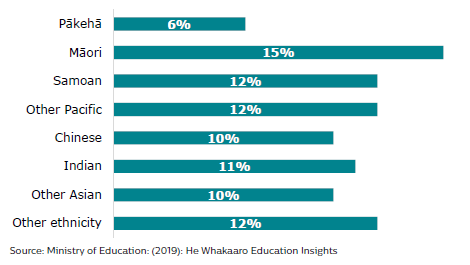
Figure 28 is a graph showing the percentages of learners from the following ethnic groups who had been treated unfairly by a teacher due to their ethnicity in the last 12 months of learners.
6% Pākehā reported they had been treated unfairly by a teacher due to their ethnicity in the last 12 months.
15% Maori, 12% Samoan and 12% other pacific people reported they had been treated unfairly by a teacher due to their ethnicity in the last 12 months.
The percentage for Chinese, Indian and other Asians and other ethnicity were 10%, 11%, 10% and 12% respectively.
Data from 2019 shows that learners from ethnic communities experience a higher proportion of ethnicity-related bullying than their European peers. Ethnicity-related bullying also occurs more frequently for secondary learners who arrived in Aotearoa New Zealand more recently (i.e., are new migrants).45
A community leader told us:
Spoken words can have long term negative impact. An Asian child did really well in school exams. Teacher asked the student ‘Did you cheat?’ This was so impactful for the student who has doubted their ability.
Both whānau and learners feel racism and racist bullying needs to be better identified and addressed by their school. Deeply concerningly, 30 percent of learners do not think their school takes racist bullying seriously (see Figure 29).
Figure 29: School takes racist bullying seriously (learner responses)
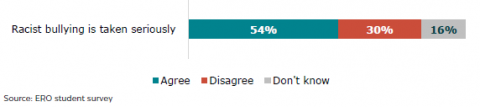
Figure 29 is a graph showing whether learners agree or disagree that racist bullying is taken seriously.
54% learners agreed.
30% reported disagreed.
16% don’t know about this.
This is in contrast to teachers, almost all (92 percent) of whom think racist bullying is taken seriously. This mismatch of perception suggests schools are not aware of the experiences of learners and whānau.
In our focus groups with learners and whānau, and in community hui and interviews, the need to better identify and address racism came through strongly. Some learners noted that teachers often disregarded or minimised their concerns about “microaggressions” or comments about ethnic background, and stereotyping ethnic or religious background. The inaction by teachers and a lack of clear boundaries about what is acceptable and not acceptable impacts on learners’ ability to counter these. Additionally, in several incidents, learners noted that leaders “took the teacher’s side or perspective” when learners reported racist encounters or incidents.
We need to talk openly about racism and discrimination in order to make significant changes. School staff needs adequate training on racism and discrimination. Schools need to have robust policies around discrimination, racism, bullying, etc. and need to make sure that every student knows where and how to reach out. Anti-racism work has to be done by everyone.
- From submission
Not being accepted and not belonging
One in five learners from ethnic communities told us they have to hide their ethnic identity at least once or twice a month. The same proportion also feel excluded from activities at school because of their ethnic identity at least once or twice a month. One in four learners report they never or almost never feel they can speak their own language at school (Figure 30).
Figure 30: How often learners feel they can speak their own language at school
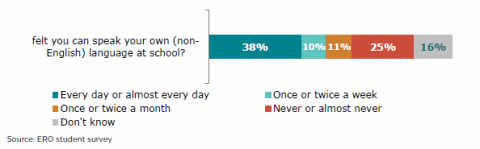
Figure 30 is a graph showing the frequency learners felt they can speak their own (non-English) language at school.
38% learners felt they can speak their own language at school every day or almost every day.
10% learners felt they can speak their own language at school once or twice a week.
11% learners felt they can speak their own language at school once or twice a month.
25% learners felt they never or almost never can speak their own language at school.
16% learners don’t know about it.
In focus groups and through community hui, learners shared instances of when they or their peers did not feel accepted due to their cultural identity. Much of this centred around cultural practices which differed from others, including religious practices, clothing, or eating.
I still feel kind of weird taking Indian food to school as you have to eat it with your hands. One of my friends—she is Indian too, got bullied so badly for her food (smelly) that she became a loner. And she tried to bring sandwiches to school even though she didn’t like them, but it was too late.
– Learner
A large secondary school was telling the parents of a Muslim student that they do not have the space for their daughter to pray so the parents will need to take their daughter home. Can you imagine the logistical nightmare?
– Community leader
Not feeling accepted or included can impact on learners’ sense of belonging, and almost one in five (17 percent) learners from ethnic communities told us they never or rarely feel they belong at school.
More than half of learners from ethnic communities feel lonely at school at least once or twice a month and over a quarter feel like an outsider at least once or twice a month (see Figure 31).
Figure 31: How often learners feel lonely, and feel like an outsider
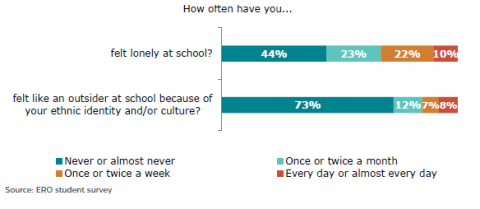
Figure 31 is a graph showing the frequency learners feeling lonely at school and feeling like an outsider at school because of their identity and, or culture.
44% learners never or almost never felt lonely at school.
23% learners felt lonely at school once or twice a month.
22% learners felt lonely at school once or twice a week.
10% learners felt lonely at school every day or almost every day.
73% learners never or almost never felt like an outsider at school because of their ethnic identity and, or culture.
12% learners felt like an outsider at school because of their ethnic identity and, or culture once or twice a month.
7% learners felt like an outsider at school because of their ethnic identity and, or culture once or twice a week.
8% learners felt like an outsider at school because of their ethnic identity and, or culture every day or almost every day.
…particularly for MELAA
Not being accepted is more pronounced for some groups, as seen in the What About Me? survey results. Learners from MELAA ethnic groups have the lowest feeling of acceptance of any group at school. This group also feel least proud of who they are, least able to express their identities, and least safe at school. They also have a low sense of belonging (see Figure 32).
Figure 32: MELAA learners’ feelings of safety, belonging, self-expression, and identity
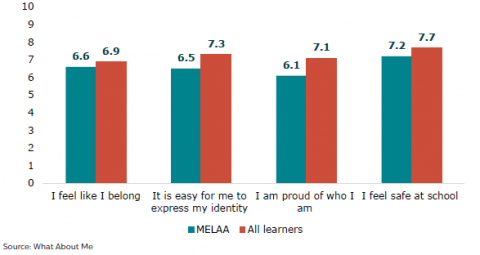
Figure 32 is a graph showing the mean scores of MELAA learners’ feelings of safety, belonging, self-expression and identity compared to all learners.
On average, MELAA learners scored 6.6 out of 10 for the statement ‘I feel like I belong.’
The score for all learners was 6.9 out of 10.
On average, MELAA learners scored 6.5 out of 10 for the statement ‘it is easy for me to express my identity.’
The score for all learners was 7.3 out of 10.
On average, MELAA learners scored 6.1 out of 10 for the statement ‘I am proud of who I am.’
The score for all learners was 7.1 out of 10.
On average, MELAA learners scored 7.2 out of 10 for the statement ‘I feel safe at school.’
The score for all learners was 7.7 out of 10.
Lack of cultural understanding
Both learners and whānau identify a lack of cultural awareness and understanding in schools.
- Half of learners experienced their teachers saying their names incorrectly within the last month (see Figure 33).
- Two in five learners confirm examples from their cultures are never or rarely used in teaching (see Figure 34).
- Almost half of learners said their teachers never or rarely helped other students learn about their language or culture (see Figure 34).
- Three in 10 whānau reported their child’s ethnic identity is not visible in their learning at school (see Figure 35).
Figure 33: Have teachers said learners’ name wrong
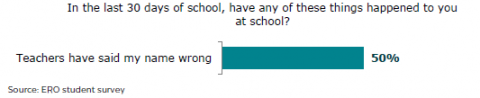
Figure 33 is a graph showing the percentage of learners who reported that their teachers have said their name wrong in the last 30 days of school.
50% learners reported they have experienced that.
Figure 34: How often teachers use examples of culture in learning and helped other learners learn about cultures
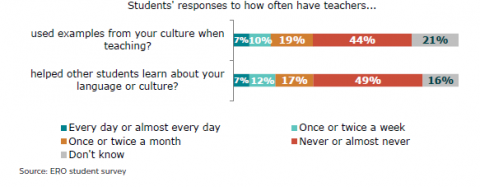
Figure 34 is a graph showing the responses of learners from ethnic groups to the following two survey questions, ‘How often have teachers used examples from your culture when teaching?’ and ‘how often have teachers helped other students learn about your language or culture?’
7% learners indicated their teachers have used examples from their culture when teaching every day or almost every day.
10% learners indicated their teachers have used examples from their culture when teaching once or twice a week.
19% learners indicated their teachers have used examples from their culture when teaching once or twice a month.
44% learners indicated their teachers have never or almost never used examples from their culture when teaching.
21% learners don’t know about this.
7% learners indicated their teachers have helped other students learn about their language or culture every day or almost every day.
12% learners indicated their teachers have helped other students learn about their language or culture once or twice a week.
17% learners indicated their teachers have helped other students learn about their language or culture once or twice a month.
49% learners indicated their teachers have never or almost never helped other learners learn about cultures.
16% learners don’t know about this.
Figure 35: Parents/whānau see their child’s ethnic identity and/or culture in lessons at school
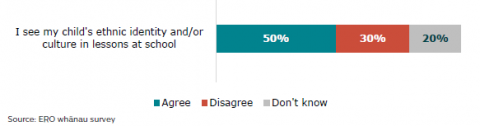
Figure 35 is a graph showing whether parents or whānau agree they see their child’s ethnic identity and, or culture in lessons at school.
50% parents or whānau agreed they see their child’s ethnic identity and, or culture in lesson at school.
30% parents or whānau disagreed with this.
20% parents or whānau don’t know.
Learners spoke to us about how teachers have limited understanding of their countries of origin, ethnicities, or cultural backgrounds. In our focus groups and community hui, participants highlighted the importance of accommodating their cultural and religious needs (for example, prayer rooms) within the school.
The school does not deem it justifiable to miss school to celebrate cultural/religious beliefs.
- Learner
Mismatch of values and practices
Whānau and community members identified that there can be a mismatch in cultural and religious beliefs and practices between home and school. Sometimes this is in relation to curriculum content, school values and practices, or broader societal values. We heard learners and whānau can sometimes experience differences in:
- expectations that religious instruction is part of the curriculum
- how cultural or religious beliefs, customs, and traditions are not respected, as reflected by what is taught in the curriculum
- what is acceptable content in sexuality education
- understandings of what activities are appropriate in Physical Education
- attitudes and religious orientations to identifying as LGBQ or transgender
- classroom discipline and what is acceptable behaviour.
To be more understandable for our religion and culture and provide activities to support our second child they almost forgot it make events for parents to be involved to understand the teaching system and stop teaching our children sex lessons completely. I am shocked when I found they will teach him that he has choice to any gender he wants I started to think to leave not just school but all NZ. I am single mother and that just a lot for me to handle or deal with it.
– Parent
When this occurs, learners often have to work out how to deal with tensions and differences in understandings and expectations themselves. In some cases, this creates the potential for learners to be excluded from learning opportunities or for misunderstandings to develop between parents and schools.
Migrant parents…often bring their collective approach into their home environment, which contradicts to the school’s preferred individual approach. These unique experiences can be heightened when they lack acknowledgment from their parents or teachers, and young people are left to negotiate the two different cultures without reference, which could lead to isolation. The latest can be a strength when one finds their feet in walking both worlds. However, it can lead to marginalisation when the two worlds collide.
- Community leader (submission)
Lack of recognition and support
Whānau also told us there is sometimes a lack of connection between school and their communities. From our survey, only 29 percent felt that members of the Board understand the needs of their ethnic communities.
One community leader described what a lack of recognition of their ethnic identity looks like for parents and whānau trying to enrol their children at local schools, and how this impacts learners and their whānau.
Recognition of the identity of children is extremely important for the self‑respect, confidence and well-being of children… members of our community who have sought to enrol in schools have been told that their ethnic identities cannot be recognised and only those that are on the list… can be recognised, and these just refer to the major countries or continents, rather than ethnic identities.
– Community leader (submission)
Poor wellbeing for MELAA
Lack of inclusion, racist bullying, and racism contribute to poor wellbeing. According to the What About Me? survey, learners from some ethnic groups are struggling more than others (see Figure 36). Students belonging to MELAA ethnic groups were the least likely to be scored as having “good to excellent wellbeing” (40 percent) on the WHO-5 rating scale (e.g., feeling cheerful, rested, and calm on most days) when compared to learners from other ethnic groups.
The WHO-5 is a well-being index that asks questions on feeling cheerful, refreshed, calm, relaxed, and having days filled with activities that are interesting. The index is a five-point scale ranging from 0 (at no time) to 5 (all of the time).
Figure 36: Overall well-being score based on the WHO-5: 2022
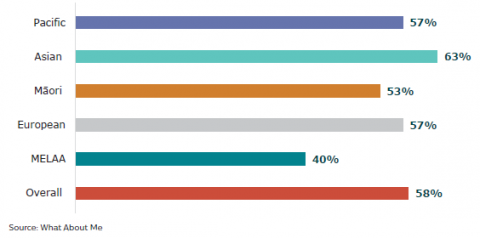
Figure 36 is a graph showing the overall wellbeing score for the following ethnic groups based on the WHO-5 in 2022.
The overall score for Pacific people was 57%.
The overall score for Asian was 63%.
The overall score for Maori was 53%.
The overall score for European was 57%.
The overall score for MELAA was 40%.
The overall score for all learners overall was 58%.
More than two in five MELAA learners indicated they were in serious distress, nearly three in five felt overwhelmed and over half felt life was not worth living. Two in five have also seriously contemplated suicide.
In focus groups with learners and whānau, and in community hui and interviews, we heard there were concerns about learners’ high levels of anxiety in managing school life and learning, and concerns about the lack of tailored mental health supports that meet their needs.
Some migrants have experienced inter-generational trauma, can be shy to share problems so you have to make the environment conducive, where they can go up and talk about their problems. Intergenerational trauma is quite a problem with immigrant kids and trauma from race-related bullying, and have counsellors [from different ethnicities] that can support you through that because they can understand it better. People even face microaggressions and racism from Pākehā counsellors or sometimes they can’t understand [issues raised] properly.
– Year 10 Learner
3. Participation and engagement
Participation and engagement at school is important for learning and supporting learners’ sense of belonging and inclusion. The way members of the school community (including leaders, teachers, learners, and whānau) interact with and support each other is key to supporting high participation and positive engagement at school.
This section looks at the following areas of participation and engagement:
- Learner representation, participation, and engagement at school:
- Areas that are stronger
- Attendance for Asian learners
- Engagement of Asian learners
- Opportunities to participate
- Possible areas of concern
- Engagement and attendance for MELAA
- Low representation of learners on Boards
- Areas that are stronger
- Whānau representation, participation, and engagement at school:
- Areas that are stronger
- Opportunities for whānau participation
- Possible areas of concern
- Barriers to whānau engagement
- Low whānau representation on Boards
- Areas that are stronger
Learner representation, participation, and engagement at school
Areas that are stronger
Attendance for Asian learners
Learners from ethnic communities have high attendance. Asian learners are more likely than other ethnic groups (i.e., MELAA, European, Māori, Pacific) to attend school all of the time (see Figure 37).
Figure 37: School attendance, by ethnicity (percentage attending all the time): 2011-2019
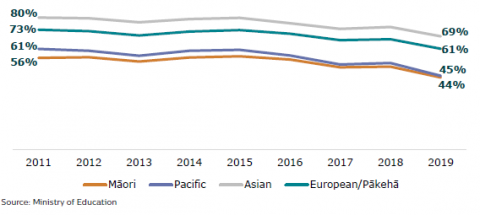
Figure 37 is a graph showing the school attendance rate (percentage attending all the time) for the following ethnic groups from 2011 to 2019.
The attendance rate for Asian decreased from 80% in 2011 to 69% in 2019.
The attendance rate for European decreased from 73% in 2011 to 61% in 2019.
The attendance rate for Pacific people decreased from 61% in 2011 to 45% in 2019.
The attendance rate for Māori decreased from 56% in 2011 to 44% in 2019.
Supporting this high attendance for Asian learners is their belief that it is important to go to school every day. Asian learners are much more likely to think it is important to go to school every day, compared to non-Asian students (see Figure 38).
Figure 38: Learners’ opinion of how important it is to attend school every day – Asian and non-Asian
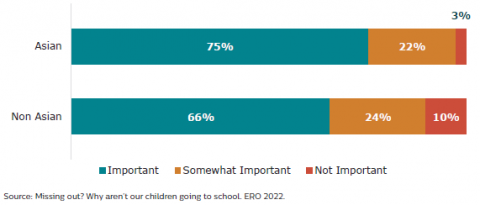
Figure 38 is a graph showing the percentage of Asian and non-Asian learners who reported it is important, somewhat important, or not important to attend school every day.
For Asian learners, 75% reported ‘important’.
22% reported somewhat important.
3% reported not important.
For non-Asian learners, 66% reported important.
24% reported somewhat important.
10% reported not important.
Asian learners also have the lowest suspension, stand-down, exclusion, and expulsion rates per 1000 learners (see for examples, Figures 39 and 40).
Figure 39: Suspension rates per 1,000 learners, by ethnic groups: 2020
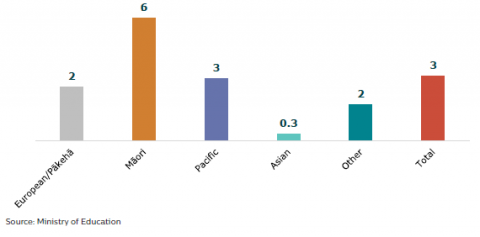
Figure 39 is a graph showing suspension rates per 1,000 learners for the following ethnic groups in 2020.
The rate for European or Pākehā was 2%.
The rate for Māori was 6%.
The rate for Pacific was 3%.
The rate for Asian was 0.3%.
The rate for people who identified them as ‘other’ ethnic groups was 2%.
The overall rate was 3%.
Figure 40: Stand-down rates per 1,000 learners, by ethnic groups: 2020
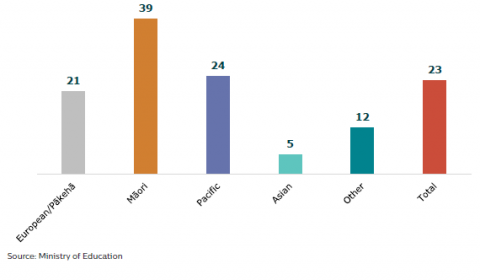
Figure 40 is a graph showing the stand-down rates per 1,000 learners for the following ethnic groups in 2020.
The rate for European or Pākehā was 21%.
The rate for Māori was 39%.
The rate for Pacific was24%.
The rate for Asian was 5%.
The rate for people who identified them as ‘other’ ethnic groups was 12%.
The overall rate was 23%.
Engagement of Asian learners
Asian learners are more likely than other learners to say they want to go to school because it is important for their future (85 percent, compared with 77 percent of non-Asian learners, as shown in Figure 41).
Figure 41: Learners’ opinion of how important school is for their future – Asian and non-Asian
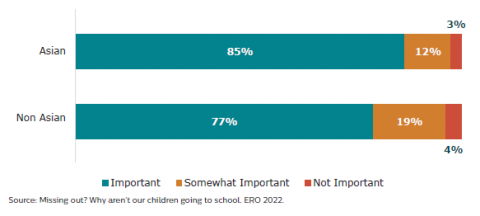
Figure 41 is a graph showing the percentage of Asian and non-Asian learners who reported school is important, somewhat important, or not important for their future.
For Asian learners, 85% reported ‘important’.
12% reported somewhat important.
3% reported not important.
For non-Asian learners, 77% reported important.
19% reported somewhat important.
4% reported not important.
Asian learners are also more likely to like or be interested in what they are taught (51 percent, compared with 35 percent of non-Asian learners) and believe it is better than staying at home
(32 percent, compared to 21 percent of non-Asian learners, see Figure 42).
Figure 42: Reasons Asian learners want to go to school
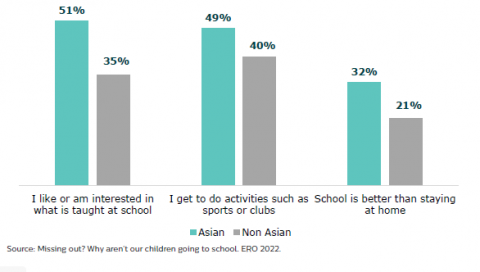
Figure 42 is a graph showing the percentage of Asian and non-Asian learners wanting to go to school for the following reasons.
51% Asian wanted to go to school for ‘I like or am interested in what is taught in school.’
35% non-Asian wanted to go to school for this reason.
49% Asian wanted to go to school for ‘I get to do activities such as sports or clubs.’
40% non-Asian wanted to go to school for this reason.
32% Asian wanted to go to school for ‘school is better than staying at home.’
21% non-Asian wanted to go to school for this reason.
Opportunities to participate
In our survey, whānau reported their children have equitable opportunities for socialising and participating in sports. This social engagement creates opportunities for these learners to develop friendships and peer relationships, which supports learners’ wellbeing and academic achievement. Figure 42 shows that Asian learners are more likely to enjoy going to school because they get to do activities such as sports or clubs, when compared to non-Asian learners.
In focus groups and interviews, parents and whānau of learners spoke of the importance of opportunities for promoting inclusion. These included sports, performance arts, cultural events, and Education Outside the Classroom. Some parents highlighted ways in which schools work collaboratively with them to ensure activities were undertaken in culturally appropriate ways to enable their child to participate fully (for example, swimming and camp activities). Learners appreciated the range of opportunities to hold leadership roles within the school.
Possible areas of concern
Engagement and attendance for MELAA
Learners with MELAA backgrounds are less likely to think school is important for their future than learners from other ethnicities. Ten percent of MELAA learners do not think school is important for their future, compared with 4 percent of other learners (Figure 43).
Figure 43: Learners’ opinion of how important school is for their future – MELAA and non-MELAA
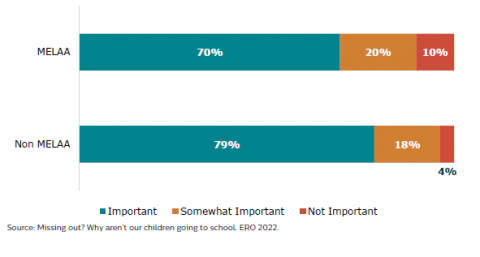
Figure 43 is a graph showing MELAA and non-MELAA learners’ opinions of how important school is for their future.
70% MELAA learners felt school is important for their future.
20% and 10% MELAA learners felt school is somewhat important or not important for their future.
79% non-MELAA learners felt school is important for their future.
18% and 4% non- MELAA learners felt school is somewhat important or not important for their future.
This attitude towards the importance of school is mirrored in MELAA learners’ views of the importance of attending school every day. Only 57 percent of MELAA learners think it is important to attend school every day, compared to 67 percent of other learners (Figure 44).
Figure 44: Learners’ opinion of how important it is to attend school every day – MELAA and non-MELAA

Figure 44 is a graph showing MELAA and non-MELAA learners’ opinions of how important it is to attend school every day.
57% MELAA learners felt it is important to attend school every day.
16% and 28% MELAA learners felt it is somewhat important or not important to attend school every day.
67% non-MELAA learners felt it is important to attend school every day.
9% and 24% non-MELAA learners felt it is somewhat important or not important to attend school every day.
The What About Me? survey46 shows only 54 percent of learners belonging to MELAA ethnic groups attend school all the time, compared to 66 percent of learners overall (see Figure 45).
Figure 45: Percentage of MELAA learners who attend their school or kura all of the time (What About Me? survey)
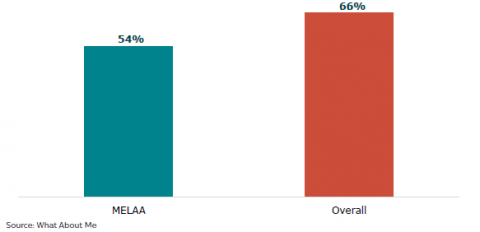
Figure 45 is a graph showing the percentage of MELAA learners who attend their school or kura all of the time from What About Me? Survey.
The percentage for MELLA learners was 54%.
The overall percentage was 66%.
Our research also indicates that MELAA learners are more likely than others not to go to school because they do not want to participate in certain activities (for example, school swimming sports), cannot participate in some activities at school, or because they find their schoolwork too hard.
We have not provided percentages due to the low number of MELAA respondents identifying each reason for wanting to miss school.
Low representation of learners on Boards
Ministry of Education data shows representation of learners from ethnic communities on school Boards is low. While Asian learners make up 14 percent of the learner population, only six percent of school Boards have an Asian learner representative (see Figure 46). Diverse representation on school Boards is important because Board members provide a voice for their communities.
Figure 46: Learner representation on school Boards: 2020
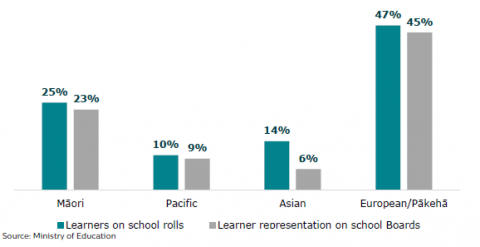
Figure 46 is a graph showing the percentage of learners on school rolls and the percentage of learner representatives on school Boards from the following ethnic groups in 2020.
47% learners were European or Pākehā on school rolls, while 45% school Boards had European or Pākehā learner representatives.
25% learners were Māori on school rolls, while 23% school Boards had Māori learner representatives.
10% learners were Pacific on school rolls, while 9% of school Boards had Pacific learner representatives.
14% learners were Asian on school rolls, while six percent of school Boards had Asian learner representatives.
Whānau representation, participation, and engagement at school
Areas that are stronger
Opportunities for whānau participation
Parents and whānau from ethnic communities attend parent-teacher meetings more than any other engagement activity with the school. Regular and timely communication between whānau and teachers creates opportunities for setting expectations, clarifying information about assessment and learning, and improving whānau participation in school activities.
In focus groups and community hui, we learned parents and whānau appreciate opportunities to be involved in schools. This includes opportunities to contribute to learning activities and share their knowledge or aspects of their culture. In some cases, their involvement becomes formalised and leads to them becoming support staff to support learning, translation, or development of resources.
We heard from whānau about ways in which they value being involved in school life, and that they are appreciative of the opportunities for this in the Aotearoa New Zealand system. They spoke of a variety of ways in which they can contribute to school activities and events, despite being non‑English speakers. For some whānau, involvement in their child’s school was the first and main point of interaction with the Aotearoa New Zealand way of life, and involvement in school helps them to understand the education system and what it has to offer.
Coming into the school I felt I was trusted as a migrant. They included me to have a teacher aide role - I felt a sense of responsibility and trust. Employment is hard, and this has a massive impact on families.
– Parent
Possible areas of concern
Barriers to whānau engagement
Nearly one third of parents and whānau of learners are not involved in school events or activities (for example, fundraising or cultural events, sharing knowledge or expertise) (see Figure 47). Whānau engagement with schools is less when they feel staff and leaders are not approachable or inclusive.
Some barriers to whānau engagement include language, frequency, and mode of communication. In our surveys, some parents and whānau mentioned they do not have email and the content in English is not accessible to them. Several parents and whānau commented that they want information from school to be translated into their language. Others mentioned further barriers to participation.
I resigned from there [parents association] because, I couldn’t relate! I found like I’m so, I’m not adding any value. I waited for two years almost, but there was no platform that they - they’re ready to listen to us.
– Parent
Figure 47: Parent/whānau participation rates in school activities
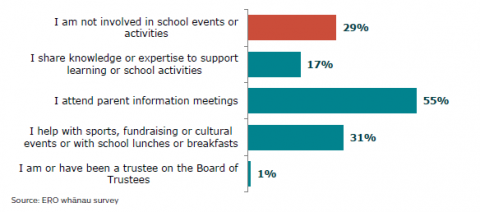
Figure 47 is a graph showing parent or whānau participation rates in school activities.
29% parents or whānau are not involved in school events or activities.
17% parents or whanau share knowledge or expertise to support learning or school activities.
55% parents or whanau attend parent information meetings.
31% parents or whanau help with sports, fundraising or cultural events or with school lunches or breakfasts.
1% parents or whanau are or have been a trustee on the board of trustees.
Low whānau representation on Boards
Ethnic parent representation on school Boards is low. Data from the Ministry of Education shows only 2 percent of Boards have Asian parent representatives (despite making up 16 percent of the population) and 8 percent other/non-stated ethnicities (see Figure 48). Only half of Asian parents and whānau agree they know the role of the Board.
Figure 48: Ethnicity of parent representatives on Boards: 2020
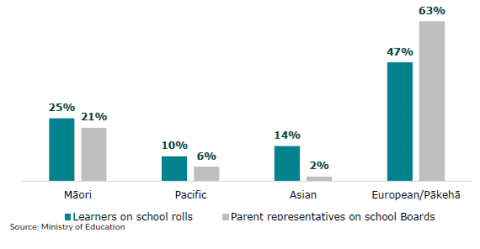
Figure 48 is a graph showing the percentage of learners on school rolls and the percentage of parent representatives on school Boards from the following ethnic groups in 2020.
47% learners were European or Pākehā on school rolls, while 63% of school Boards had European or Pākehā parent representatives.
25% learners were Māori on school rolls, while 21% of school Boards had Māori parent representatives.
10% learners were Pacific on school rolls, while 6% of school Boards had Pacific parent representatives.
14% learners were Asian learners on school rolls, while 2% of school Boards had Asian parent representatives.
4. Learning pathways and destinations
Like all learners and their families, learners from ethnic communities want education to provide them with pathways into future careers. This includes making sure learners, and their parents and whānau understand the choices available to them, and receive good career counselling and advice on course choices for future learning or work.
This section looks at the following areas for destinations and learning pathways:
- Expectations and aspirations of learners and whānau
- Areas that are stronger
- Expectations for education
- Aspirations
- Areas that are stronger
- School support for learning pathways and course selection
- Areas that are stronger
- Link between education and employment
- Possible areas of concern
- Racial bias in career advice
- Lack of access to home language
- NCEA is confusing
- Areas that are stronger
- Post-school destinations across ethnic groups
- Areas that are stronger
- Enrolment in tertiary education
- Possible areas of concern
- Future teachers
- Areas that are stronger
Expectations and aspirations of learners and whānau
Areas that are stronger
Expectations for education
Learners’ engagement, participation, and academic achievement are all strengthened by having clear goals, and support to plan for them.
Almost all parents and whānau from ethnic communities have high expectations and see the following three things as important for schools to help their children to develop:
- social skills and friendships
- literacy and numeracy skills
- English language skills.
Expectations also include support for language and culture. Almost 65 percent of whānau think schools should teach about their child’s culture, and their mother tongue should be supported. This suggests parents and whānau want their culture and language recognised and acknowledged by schools.
Aspirations
Learners and whānau from ethnic communities have high expectations and aspirations for success in the education system.
The What About Me? survey found that 75 percent of Asian and 71 percent of MELAA learners said a university degree was the highest level of qualification they wanted to achieve in the future, which is much higher than the Aotearoa New Zealand average for learners (62 percent (see Figure 49)).
Figure 49: University aspirations of learners from ethnic communities
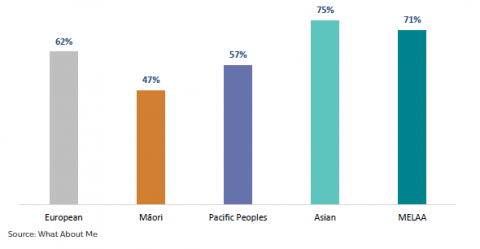
Figure 49 is a graph showing the percentage of learners from the following ethnic groups who indicated a university degree was the highest level of qualification they wanted to achieve in the future from the ‘What about me’ Survey.
The percentage for European/ Pākehā was 62%.
The percentage for Māori was 47%.
The percentage for Pacific Peoples was 57%.
The percentage for Asian was 75%.
The percentage for MELLA was 71%.
In our focus groups, learners described their intentions for tertiary study and professional careers. They spoke of being motivated by their families and for achieving educational success to honour and make contributions to their families.
Parents and whānau of learners from ethnic communities have high expectations for their child’s achievement, and a wide range of aspirations for their child (for example, equal opportunities for learning, freedom for self-expression).
School support for learning pathways and course selection
Areas that are stronger
Link between education and employment
The majority of learners (80 percent) from ethnic communities and their parents and whānau (92 percent) we surveyed agree their learning at school is useful for future learning and work (see Figure 50).
Figure 50: Parents/whānau and learner perceptions regarding the usefulness of their learning for future work/learning
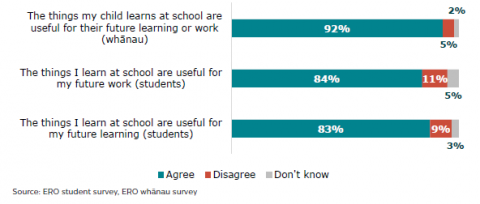
Figure 50 is a graph showing whether parents or whānau and learners agree with the following three statements regarding the usefulness of their and their children’s learning for future work or learning.
92% parents or whanau agreed that ‘the things my child learns at school are useful for their future learning or work.’
5% parents or whanau disagreed with it.
2% parents or whanau don’t know.
84% learners agreed that ‘the things I learn at school are useful for my future work.’
11% learners disagreed with it.
5% learners don’t know.
83% learners agreed that ‘the thing I learn at school are useful for my future learning.’
9% learners disagreed with it.
3% learners don’t know.
In our focus groups, learners who have regular academic mentoring by teachers at school also have clear aspirations for themselves. They talked about their plans to study further and enrol in medical school, engineering, architecture, design, and film-making courses among others. We also heard how there are opportunities for learners to hear from a range of adults of diverse ethnicities employed in different jobs. This offers learners a chance to consider a range of future destinations and pathways for themselves.
Seventy nine percent of secondary learners (and 62 percent of parents) agree their school helps with understanding subject choices and career options (see Figures 51 and 52).
Figure 51: Secondary learners’ experience with school support on advice for future learning/work
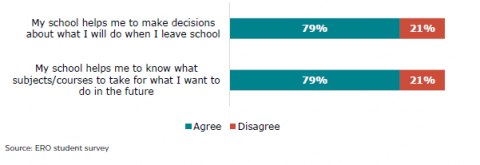
Figure 51 is a graph showing whether secondary learners agree with the following two statements regarding to their experience with school support on advice for future learning/ work.
79% secondary learners agreed that ‘my school helps me to make decisions about what I will do when I leave school.’
21% secondary learners disagreed with it.
79% secondary learners agreed that ‘my school helps me to know what subjects or courses to take for what I want to do in the future.’
21% secondary learners disagreed with it.
Figure 52: Parents/whānau experience with school support on advice for future learning/work
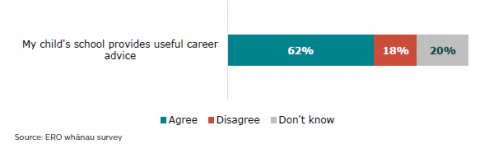
Figure 52 is a graph showing whether parents or whānau agree or disagree that their child’s school provides useful career advice.
62% learners agreed.
18% learners disagreed.
20% learners don’t know.
Possible areas of concern
Racial bias in career advice
Disappointingly, more than one in four secondary learners from ethnic communities and almost one in five parents and whānau reported their teachers think they should take some subjects/courses because of their ethnic identity and/or culture (see Figures 53 and 54). Ethnic identity should not influence what teachers think about learner course choices.
Figure 53: Secondary learners’ experience of subject choice guidance
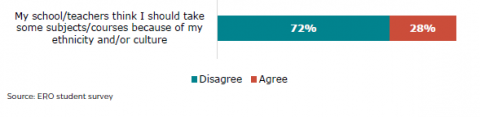
Figure 53 is a graph showing whether secondary learners agree or disagree that their school or teachers think they should take some subjects or courses because of their ethnicity and or culture.
72% learners disagreed.
28% learners agreed.
Figure 54: Parents/whānau experience of subject choice guidance
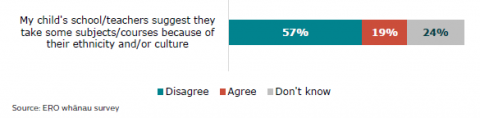
Figure 54 is a graph showing whether parents or whānau agree or disagree that their child’s school or teachers suggest they take some subjects or courses because of their ethnicity and or culture.
57% parents disagreed.
19% parents agreed.
24% parents don’t know.
About one fifth (21 percent) of secondary learners do not feel supported by their school with career advice, or when choosing subjects/courses for future learning or work.
Only half of secondary learners are fully happy with their subject choices (see Figure 55).
Figure 55: Secondary learners’ satisfaction regarding subject choices
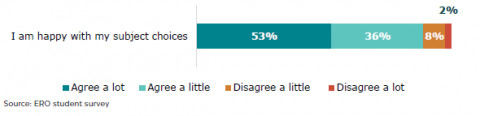
Figure 55 is a graph showing the extent to which secondary learners agree or disagree that they are happy with their subject choices.
53% learners agreed a lot.
36% learners agreed a little.
8% learners disageed a little.
2% learners disagreed a lot.
In focus groups, we heard about the challenges learners encounter when planning their learning pathway. These include a lack of timely advice, and the need to push back against ethnic stereotypes. These experiences can be discouraging for both learners and their parents and whānau, contributing to disengagement at school.
I still don’t know what I want to do when I leave here, and I think it gets more and more urgent each passing day because as I move on through the years, the options get narrower and narrower and I need to make a decision on a set pathway to go down - had an initial conversation about pathways in Year 9, but not really anything since.
– Year 11 learner
Other learners spoke of the pressure to conform to stereotypes about destinations and how this sometimes limits their opportunities to consider different options.
I take all the sciences and STEM subjects – my teachers are quite ‘you want to go to med school’ and feel like a lot of people think – Oh she’s Indian so of course she wants to go to Med School!
– Year 11 learner
Lack of access to home language
Learners from ethnic communities and their whānau expressed deep concerns about the lack of opportunities to study their home language, and the impact this has on their connection to their culture. We heard in community hui and submissions that it is a challenge to maintain home languages due to lack of learning opportunities.
NCEA is confusing
In our surveys, we learnt 51 percent of parents/whānau reported they find NCEA confusing and 47 percent find the school system in Aotearoa New Zealand confusing (see Figure 56).
Figure 56: Parent/whānau confusion about NCEA and Aotearoa New Zealand school system
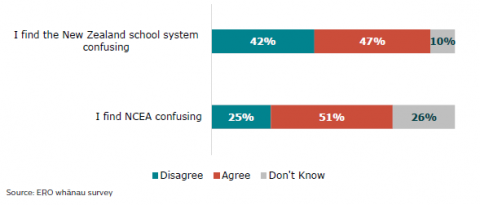
Figure 56 is a graph showing whether parents or whānau’s agree with the following two statements regarding to NCEA and Aotearoa New Zealand school system.
42% parents or whānau disagreed that ‘I find the New Zealand school system confusing.’, while 47% parents or whānau agreed with it. 10% parents or whānau don’t know about it.
25% parents disagreed that ‘I find NCEA confusing.’, while 51% parents or whānau agreed with it.
26% parents or whānau don’t know about it.
We also found that 59 percent of secondary learners are confused about how NCEA works (see Figure 57).
Figure 57: Secondary learners’ confusion about NCEA
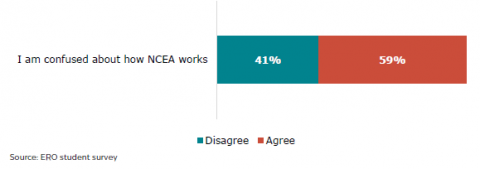
Figure 57 is a graph showing the percentage of secondary school learners who agreed or disagreed with the statement that ‘I am confused about how NCEA works.’
41% learners agreed while 59% disagreed.
In our focus groups with learners and interviews with parents, there was a range of understanding about the NCEA system. Learners who had regular academic mentoring by teachers were more confident about their progress towards credits and their achievement in relation to their courses. In contrast, one learner had ended the year without knowing she had not had sufficient opportunity to gain the credits required for gaining UE, and had to take an additional course over summer.
I couldn’t understand the credit system. And she failed! It hurts me every single day – she couldn’t pass her English exam. And that’s why she couldn’t get enrolled in her Uni for this year - she couldn’t understand the expectation, like what teachers are expecting. She couldn’t understand.
– Parent
Post-school destination across ethnic groups
Areas that are stronger
Enrolment in tertiary education
Asian learners have the highest enrolment in undergraduate and post-graduate programmes compared to Māori, Pacific, MELAA, and European students (Figure 58).
Asian learners are least likely to not be in employment or education after school. Only 7 percent of Asian 15 to 19 year olds (percentage of the working age population) are not in education, employment or training (NEET), compared with 8 percent European, 16 percent Māori and 14 percent Pacific Peoples. The percentage of MELAA 15 to 19 year olds is not measured.
Figure 58: 2020 enrolment in Bachelors or above, by ethnicity
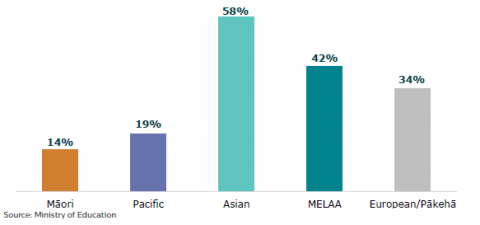
Figure 58 is a graph showing the percentages of 2019 school leavers among the following ethnic groups who enrolled in Bachelors or above programmes in 2020 (their first year after leaving schools).
58% Asian enrolled in bachelor’s and above programmes.
42% MELAA enrolled in bachelor’s and above programmes.
The enrolment rates for European/ Pākehā, Pacific people and Māori were 34%, 19% and 14% respectively.
Possible areas of concern
Future teachers
In our conversations with learners, whānau and community members, there was concern at the lack of ethnic diversity in the teaching staff at schools.
Currently, Asians are under-represented as teachers employed in schools (see Figure 59). Enrolments in Initial Teacher Education (ITE) indicate that Asian under-representation as teachers is likely to continue with Asians making up only 9 percent of Initial Teacher Education (ITE) enrolments in 2021, compared to 76 percent European, 21 percent Māori, 8 percent Pacific Peoples, and 4 percent Other.
Figure 59: Number of teachers employed in schools, by ethnicity: 2021
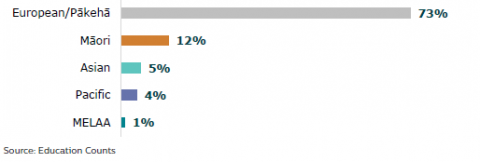
Figure 59 is a graph showing the percentage of teachers employed in schools who are from the following ethnic groups in 2021.
73% employed schoolteachers were European/ Pākehā.
12% employed schoolteachers were Māori.
5%, 4% and 1% employed teachers were Asian, Pacific people and MELAA.
There is limited information about other ethnic groups. This gap in knowledge leaves us with fewer insights into the experiences of diverse ethnic populations in Aotearoa New Zealand.
Conclusion
While many learners from ethnic communities achieve well, have high attendance and go on to tertiary study, they have to overcome widespread racism, isolation, lack of cultural understanding, and confusing pathways to do that. We need to do better.
Feedback prompts
- How well do you relate to the findings in this section?
- What sits well with you?
- What is surprising?
- What is missing from this story?
Part 3: How are schools meeting the needs of learners from ethnic communities and their whānau?
Learners from ethnic communities and their whānau reported a variety of educational experiences. While not all of these are positive, we identified a number of teaching practices and activities that have positive impacts for learners.
This section describes what schools are doing for learners from ethnic communities – the strategies that work, and areas to improve.
How we gathered information
This section draws on information shared with us about school practices through:
- focus groups and interviews with teachers and senior leaders, community groups, learners and whānau
- whānau and learner surveys
- teacher surveys
Overview
The OECD conceptual framework for inclusive education47 sets out the key elements for schools and the education system to act on to promote inclusive education for learners from ethnic communities. These are:
- developing capacity for managing diversity, inclusion, and equity in education
- recruitment, retention, preparation, and evaluation of school staff
- preparation of all students for diversity in education
- promoting school-level interventions to support diversity, inclusion, and equity in education
- matching resources within schools to individual student learning needs
- learning strategies to address diversity
- non-instructional support and services
- engagement with parents and communities
- monitoring and evaluating diversity, inclusion, and equity in education
- evaluating processes for diversity, inclusion, and equity in education at the local and school level.
This section describes:
Combining the guidance from the OECD framework and what we know about quality education in the context of Aotearoa New Zealand, we identified five key practices that have a strong impact on the quality and equity of experiences for learners:
- School leaders prioritise learners from ethnic communities and commit to supporting, respecting, and celebrating their cultures
- Everyone has high expectations of learners from ethnic communities
- Teachers understand, value, and include learners’ culture in their education
- Teachers learn about and enact culturally responsive teaching and inclusive practices
- School leaders and teachers connect and partner with whānau and their ethnic communities
In each section we look at:
- why it is important
- what good practice looks like
- what we found.
1. School leaders prioritise learners from ethnic communities and commit to supporting, respecting, and celebrating their cultures
Why it matters
International research tells us effective leaders have a strong positive influence on students’ learning, attendance, and long-term outcomes.48 What they do and say matters, as it sets the standard and direction for the whole school community.
Learners and whānau have better experiences of education in schools when leaders show they value and respect the diversity in their school and community.
Culturally responsive leaders are able to engage teachers, learners and whānau in discussions about inclusion, promote positive attitudes, and combat prejudices49 – all of which contributes to creating an inclusive school. They can direct teacher professional development to ensure it is culturally responsive, which then improves the classroom experiences of learners.50 This includes ensuring that lessons reflect the cultural diversity in their class, and classrooms are places of inclusion and respect.
What good practice looks like
The Code of Professional Responsibility and Standards for the Teaching Profession51 sets clear expectations for teachers to provide learners with an environment where “they can be confident in their identities, languages, cultures, and abilities” and where “the diversity of the heritage, language, identity, and culture of families and whānau are respected”.
Effective leaders promote a whole-of-school approach to inclusion,52 demonstrate culturally responsive practice, and have “a relentless focus on acknowledging and respecting difference”.53
Key practices for leaders:
-
- Prioritise relationships and connection with families and community networks.
- Promote the inclusion of various forms of difference and make it a normal and valued part of the school.
- Make clear statements about valuing diversity and cultural identity in strategic and curriculum documents.
- Ensure all policies and plans incorporate inclusion and diversity.
- Spend time engaging respectfully with whānau and learners to learn about their aspirations and concerns.
- Provide additional support for families who find it difficult to navigate the system.
- Ensure there are good systems to support sharing good practice, and for reviewing provision and outcomes for learners from all ethnic communities.
- Establish schoolwide practices for respectful behaviour and communication that reflect an openness to differing attitudes, beliefs, and world views.
- Ensure school rules are inclusive of a range of cultural practices.
- Provide professional learning that supports staff to positively respond to diversity, surface unconscious bias and to teach about, and counter, discrimination.
What we found
We heard a variety of experiences from learners and their whānau, some of which highlighted where schools can strengthen their practice and focus their leadership influence. We also saw a range of leadership practices that were meaningful for learners and communities.
Challenges we found
Although many learners and whānau were positive about how their schools include their cultural practices, some participants spoke about the way in which these celebrations do not always authentically reflect the ethnicities and cultural practices of learners and their whānau. This has the potential for learners to feel further marginalised through not seeing themselves represented in activities.
When schools set up a celebration day and the teacher doesn’t know the history or importance of what is being celebrated.
– Community leader
Across all schools, we found too many whānau (7 percent) and learners (17 percent, see Figure 60) who feel their culture is not respected or valued at school.
Figure 60: How often learners feel ethnic identity and/or culture is respected at school
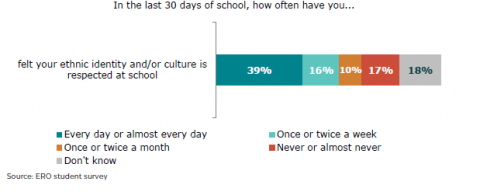
Figure 60 is a graph showing the frequency learners felt their ethnic identity and or culture is respected at school.
39% learners felt their ethnic identity and or culture is respected at school every day or almost every day.
16% learners felt their ethnic identity and or culture is respected at school once or twice a week.
10% learners felt their ethnic identity and or culture is respected at school once or twice a month.
17% learners never or almost never felt their ethnic identity and or culture is respected at school.
18% learners don’t know.
Additionally, learners we spoke to at some schools identified a lack of opportunity to connect with learners from their culture.
I feel like the only time you can interact with your own culture is culture week.
– Secondary school learner
About 40 percent of teachers also reported a lack of opportunity for learners to connect with other learners (see Figure 61).
Figure 61: How well schools provide opportunities for learners to access cultural groups
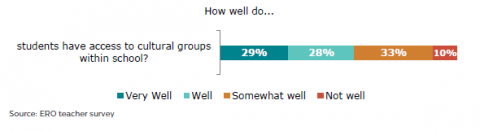
Figure 61 is a graph showing teachers’ responses to the survey question: how well do students have access to cultural groups within schools?
29% teachers reported very well.
28% teachers reported well.
33% teachers reported somewhat well.
10% teachers reported not well.
Good practice we found
Whānau and learners in schools that prioritise them and their cultures show a strong sense of belonging and engagement.
In our interviews and focus groups, whānau described a range of inclusive practices schools engaged in. For example, valuing food and religious practices and having flexible uniforms to accommodate the needs of different ethnic communities.
Nearly 54 percent of learners and 74 percent of whānau surveyed said their school celebrates their culture through events. In all focus group conversations and interviews, learners and whānau identified ways in which schools celebrate different cultures, calendar events and language weeks. Such celebrations were valued for acknowledging diversity itself, which makes them feel valued and welcomed. It also gives opportunities to connect with others and feel part of school life.
Most whānau felt their child’s school is supportive in dealing with issues and concerns that were raised.
Some school leaders spoke about the ways in which they spend time with families and learners to get to know them and make them feel they belong.
Being welcoming – It’s about bringing them in, letting them see, making them feel comfortable, seeing that its safe and supportive, showing them that we care about their children.
– School leader
Examples of successful strategies shared by schools:
- Appointing cultural facilitators/ leaders
In one school, several leaders with expertise and experience with ethnic communities supported provision. One leader’s role was to connect with and network with people and organisations in the community to search out and provide support for identified needs. Leaders liaised with families from ethnic communities and assembled bi-lingual teams with translators for learners and their whānau. At the school level they shared resources and articulated and modelled culturally responsive practice to support teachers. They monitored learners’ outcomes and reviewed provision and initiatives across the school.
- Leaders being visible in ethnic communities
In several schools, cultural leaders and the principal regularly attend community events, first language classes or church meetings hosted by different ethnic groups to show respect and connect with families and community leaders. These events offer opportunities to build relationships, offer support, listen to community views, and communicate information.
- Making visible in the environment
Several schools have undertaken large scale, semi-permanent art projects to celebrate the ethnic diversity represented at school. The process included research and collaboration with community members, whānau, and students. In two schools, visual displays were developed around significant stories of mana whenua and incorporated symbols and stories from other cultures.
2. Everyone has high expectations of learners from ethnic communities
Why it matters
We know that high expectations of learners are key to their engagement and success. For learners from different cultural backgrounds or learning environments, it is particularly important as low expectations lower achievement and motivation. Communicating high expectations raises learners’ levels of interest and self-belief which push them to attempt difficult tasks, achieve success and grow. High expectations also demonstrate teachers are thinking and acting inclusively as they are holding learners from ethnic communities to the same high standards as any other learner.54
What good looks like
Our Code | Our Standards55 sets clear expectations for a learning-focused culture where teachers “demonstrate high expectations for the learning outcomes of all learners”. This includes a commitment to learners which requires teachers “to be fair and effectively manage their assumptions and personal beliefs”.
It is important for teachers to be open-minded and unbiased when considering learners’ potential so they can recognise their abilities, interests and prior learning experiences to help them access new learning.
Key practices for teachers:
- Recognise their own cultural frames of reference and understand how their assumptions and beliefs influence their teaching.
- Enable learners to set high expectations for themselves by creating opportunities for learners to share their aspirations, set goals, and make choices about their learning.
- Develop their understanding of the learner’s capabilities, express their expectations for the learner, offer appropriate levels of challenge, and give specific feedback on learning tasks.
- Reflect on their biases and assumptions to ensure these are not negatively affecting how they view learners from ethnic communities.56
- Move away from defining learners from ethnic communities primarily as ESOL or English language learners.
- Support learning and frame diversity as an asset rather than a challenge.
- Invest in and take personal responsibility for students’ success.
- Provide multiple options for how students can interact with instructional content and assessment.
What we found
We found learners from ethnic communities and their whānau experience a mix of expectations about their learning. Some teachers are implementing impactful strategies to support learners’ learning.
Challenges we found
Our survey results suggest that too many teachers do not have a good understanding of the capabilities of learners. Nearly a quarter of whānau (27 percent) said teachers never or rarely have high expectations for their child's learning.
Forty percent of learners and 39 percent of whānau thought schoolwork was easy or very easy (see Figure 20).
Some learners also spoke to us about how teachers make assumptions about their learning ability based on their level of English proficiency or their participation in class discussions.
Sometimes when I’m called on in class I feel pressured and sometimes can’t get my words out about what I’m thinking or take too long to answer and so I look like I don’t understand the question
– Student
More than one in four (28 percent) learners and whānau agreed that their ethnic identity influences what teachers think about their course selection.
Good practice we found
Sixty eight percent of learners said their school helps them very well with their learning, and their parents agree. Most (80 percent) parents and whānau of learners from ethnic communities agree their child’s school gives them good information about their child’s learning. They feel they know how well their child is learning and progressing, and are happy with their child’s progress (see Figure 62).
In other schools we never saw the principal or teachers, asked a teacher how your child is doing and they say they’re fine. But here, teachers are in touch with you, they’re assessing your child constantly – your child needs help with this – let’s help them!
– Parent
Figure 62: Parent/whānau satisfaction with their child’s progress
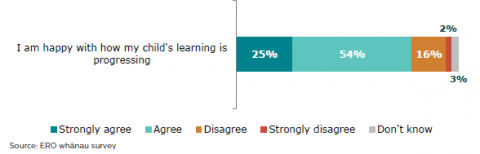
Figure 62 is a graph showing the extent to which do parents or whānau agree that they are happy with how their child’s learning is progressing.
25% parents or whānau strongly agreed.
54% parents or whānau agreed.
16% parents or whānau disagreed.
2% parents or whānau strongly disagreed.
3% parents or whānau don’t know.
Members of the community reported some schools have an equitable system that allows for equal access and opportunity to all learners thought ensuring all learners can participate in learning and co-curricular activities.
Examples of successful strategies shared by schools:
- Academic mentoring by teachers
In several schools a teacher regularly meets individually with students to discuss their learning progress over their time in school. They talk about their aspirations and find ways to support them to gain credits, or take courses towards achieving their goals. In one school they have a transitions team made up of leaders who meet with each senior student to discuss their aspirations and pathways. This team meets weekly to discuss the progress of each of their learners towards their goals.
- Setting challenging tasks
Teachers provided tasks with a high level of challenge which built on student prior knowledge and learning. The tasks enabled students to make choices about their learning, and connect to their culture and language. Teachers provided specific support to enable them to access the task and experience success.
- Communicating expectations
In some schools, teachers communicate their high expectations for these learners through detailed feedback to students and whānau about their learning and next steps.
3. Teachers understand, value, and include learners’ culture in their education
Why it matters
Teachers who affirm and respect learners’ cultural identities and include their cultures in their learning have a positive influence on learner learning.57 Because these teachers value the cultural knowledge and perspectives of their learners, they can create equitable learning environments that validate and support learning for all learners.
What good looks like
The Teaching Council of Aotearoa New Zealand sets clear expectations for teachers to respect the diversity of the heritage, language, identity, and culture of all learners through Our Code | Our Standards. Teachers need to “harness the rich capital that learners bring by providing culturally responsive and engaging contexts for learners”.
When schools value ethnic diversity and want to do well for their learners from ethnic communities, they prioritise helping learners feel they belong. They find ways to show they value their cultures, and celebrate this in their teaching and school practices.
Teachers demonstrate they understand and value cultural diversity through the ways in which they show interest in learning about learners’ cultural practices and language, and provide opportunities for learners to share or regularly make links to their culture through learning activities. They recognise and deeply value the richness of the cultural knowledge and skills that learners bring to the classroom as a resource for developing multiple perspectives and ways of knowing.58
Key practices for teachers:
-
- Search out knowledge to understand the cultures of their learners and their whānau.
- Be alert to daily opportunities to make links to cultural practices and build the cultural knowledge of all learners.
- Find ways to demonstrate learners’ home languages and cultural knowledge as assets in the classroom.
- Capitalise on learners’ cultural backgrounds rather than attempting to override or negate them.
- Use learners’ strengths as instructional starting points.
- Connect learning to the histories of racial, ethnic, and linguistic communities both locally and nationally.
- Draw on learners’ cultural knowledge (culturally familiar scenarios, examples, vignettes), life experiences, frames of reference, languages, and performance and communication styles to facilitate learning.
- Develop learners to think critically, examine bias in words and visual images and confront stereotypes or racism when it appears.
What we found
Despite teachers reporting their teaching reflects the cultures of their learners, learners and their whānau reported very different experiences. This suggests a mismatch in understandings between what learners want and need, and what teachers provide.
Challenges we found
Whānau and learners are concerned about teachers’ lack of cultural knowledge and awareness. In community hui and focus groups with learners, they shared a range of examples which demonstrated misunderstanding and lack of sensitivities about cultural practices.
Teachers (inadvertently) belittle kids with different ethnic practices. A young child eating with their hands was told “that’s disgusting” and physically removed child’s hand from her rice and directed the child to use a spoon.
- Community member
When we asked learners about their experiences in the classroom, nearly half reported their teachers never or almost never includes examples from their culture or helps others to learn about their culture (see Figure 34).
Teachers also reported having limited understanding of learners’ cultural practices and needs. Almost half of teachers stated they do not feel confident in connecting with ethnic communities to support learning and curriculum delivery – a vital pathway to ensuring learning is linked to the cultural knowledge and heritage of learners (see Figure 63).
Figure 63: Teacher confidence to connect with community to support learning
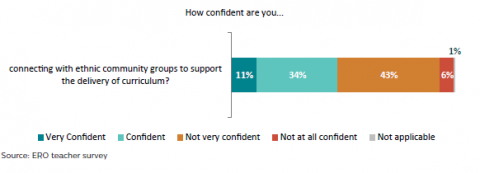
Figure 63 is a graph showing the extent to which did teachers feel confident connecting with ethnic community groups to support the delivery of curriculum.
11% reported very confident.
34% reported confident.
43% reported not very confident.
6% reported not at all confident.
1% reported not applicable.
In focus groups and hui, we heard how teachers’ sometimes limited understanding of culture can impact learners in the classroom.
Teachers focus on English language as a prerequisite to access the curriculum. They do not try to understand student’s strengths.
– Parent
Good practice we found
Despite low teacher understanding, 79 percent of teachers reported they are confident to incorporate learners’ cultural knowledge into teaching and learning (see Figure 64).
Figure 64: Teacher confidence incorporating learners’ cultural knowledge into teaching and learning
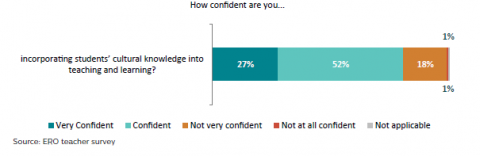
Figure 64 is a graph showing the extent to which did teacher feel confident incorporating students’ cultural knowledge into teaching and learning.
27% reported very confident.
52% reported confident.
18% reported not very confident.
1% reported not at all confident.
1% reported not applicable.
In focus groups with teachers, they spoke of ways in which they deliberately seek out information about the cultural backgrounds, practices, and home languages of their learners through talking with them and their whānau. They work to ensure they develop in-depth understanding of cultural practices and help support the learning of others.
These teachers provide opportunities and review resources to ensure learners from ethnic communities regularly have opportunities to share or make links to their culture through classroom learning activities. They are highly alert to opportunities to make links to cultural practices and build the cultural knowledge of all learners.
Examples of successful strategies shared by schools were:
- Regular cultural sessions
In one school, teachers provided weekly timetabled First Language Time for students of similar cultural backgrounds or ethnicities. Students met and connected with other students in their school with a similar heritage, language, or culture. In these sessions they spoke in their first language or learned their heritage language as they engaged in culturally based activities. This was sometimes supported by expertise from the wider school community and learners were provided opportunities for show-casing different languages, such as introducing the school production and creating multilingual signs and displays around the school.
- Supporting the engagement and learning of migrant and multi-lingual students
In one school a teacher worked in a purposeful way to include the cultures and prior learning of students to help them engage in task-based activities. This approach included: getting to know the learners’ strengths and needs; ‘gentle’ diagnostic activities to surface ways of thinking, interests, prior knowledge, and skills; and ‘pre‑loading’ discussion or activities. The teacher then discussed examples of the end-task and provided explicit teaching in response to individual needs. Students were then able to engage at the step they recognised and are supported to build towards the end task.
- Writing in first language
One school provides annual opportunities for English Language Learners to work with members of their local community to write in their first language and publish a journal in multiple languages. Publications are launched at a prestigious community event and the stories are highly celebrated.
4. Teachers learn about and enact culturally responsive teaching and inclusive practices
Why it matters
Learners’ engagement and success in learning is promoted when teachers’ practice is culturally responsive. Culturally responsive teaching better enables teachers to design their lessons and deliver a curriculum in a way that builds on the strengths and funds of knowledge learners bring to their learning. This supports students to engage meaningfully in learning and promotes their achievement.
What good looks like
The Teaching Council of Aotearoa New Zealand expects teachers “develop an environment where the diversity and uniqueness of all learners are accepted and valued”.59
An essential foundation for enacting culturally responsive teaching is knowing the learner. Teachers’ understanding of their learners, including their culture, is key to learners’ experiences. This is underpinned by a strong focus on relationships which demonstrate reciprocal learning partnerships (ako), development of extended family-like relationships (whanaungatanga) and a culture of caring, mutual respect and trust (manaakitanga). Teachers provide culturally secure learning environments which give value to community languages, practices, and ways of being.
Key practices for teachers:
- Show a willingness to learn and actively seek information about the learner, their ethnicity and whānau.
- Pronounce the names of their learners and their whānau correctly.
- Develop an understanding of unfamiliar cultural practices and their underpinning ideologies to avoid being tokenistic.
- Create environments which are rich with cultural artifacts.
- Develop a welcoming, positive classroom climate that promotes empathy and dialogue in classroom interactions.
- Model and foster inclusive language and respectful relationships.
- Create safe and inclusive spaces (physical and social) where learners of all ethnic groups can safely connect over issues of importance.
What we found
Although teachers expressed some confidence in delivering culturally responsive learning, we heard from learners and their whānau that teacher cultural competence is sometimes lacking.
Challenges we found
Learners and whānau we spoke to told us that important aspects of their cultural identity or background are not always sought or known by teachers.
Learners, whānau, and community members clearly identified concerns about teachers’ cultural competence and unconscious biases demonstrated in practice. This is seen in the selection of examples used in learning and the way in which teachers are unaware of key practices, events or developments affecting ethnic communities or their home countries. Learners, whānau and community members also highlighted the existing lack of diversity among teaching staff. Learners noted how this is sometimes a barrier to approaching staff for support.
Staff and support staff are not diverse, [there is] almost no one to support students from ethnic community background
– Community member
One in five teachers also reported only a limited understanding of cultural practices of the learners they teach (see Figure 65).
Figure 65: Teachers’ knowledge of the cultures of their learners
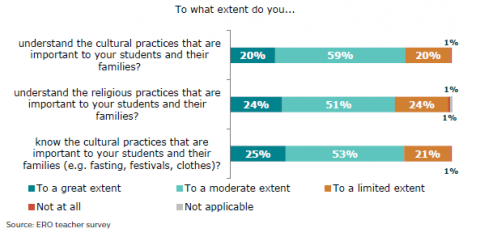
Figure 65 is a graph showing teachers’ responses to the following three questions associated with the knowledge of the cultures of their learners.
The first question is to what extent do you understand the cultural practices that are important to your students and their families.
20% reported to a great extent.
59% reported to a moderate extent.
20% reported to a limited extent.
1% reported not at all.
The second question is to what extent do you understand the religious practices that are important to your students and their families?
24% reported to a great extent.
51% reported to a moderate extent.
24% reported to a limited extent.
1% reported not at all.
1% reported not applicable.
The third question is to what extent do you know the cultural practices that are important to your students and their families, for example fasting, festivals and cloths.
25% reported to a great extent.
53% reported to a moderate extent.
21% reported to a limited extent.
1% reported not at all.
More than 50 percent of teachers agreed it is challenging to cater to a range of ethnicities and over half do not feel confident in connecting with ethnic communities to support learning and curriculum delivery.
Good practice we found
Most teachers said they are confident or very confident in implementing culturally responsive practice (Figure 66).
Figure 66: Teacher confidence in delivering culturally responsive learning
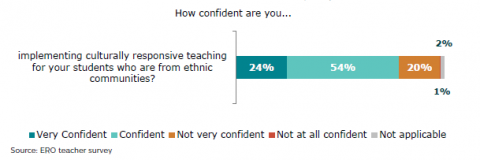
Figure 66 is a graph showing the extent to which did teachers feel confident implementing culturally responsive teaching for your students who are from ethnic communities.
24% reported very confident.
54% reported confident.
20% reported not very confident.
2% reported not at all confident.
1% reported not applicable.
Teachers shared how it is important to be alert to ways to incorporate multicultural and multilingual content into learning.
An approach taken by several schools is to use te ao Māori as a launching pad for supporting teaching and learning for learners from ethnic communities. These teachers seek out opportunities to build relationships with learners and their whānau.
Growing understanding of te ao Māori and our bicultural journey has had a significant impact. It has made us more sensitive towards others. More awareness of your own perspective helps. A strong and enriching journey –opens your ears, your heart and brain to other cultures…Its not bicultural OR multicultural – Its bicultural AND multicultural
– Teacher
In focus groups we heard about how teachers focus on being sensitive to different cultural practices or potential conflicts, and are courageous to lead difficult conversations. Teachers note how the newly introduced Aotearoa New Zealand histories curriculum is opening up conversations about a range of cultural practices and recognise the potential for supporting understanding of and belonging for other ethnic groups in their school.
In schools that are doing this well, culturally responsive practice is a focus for professional development opportunities within the school, and is often grounded in effective practice for supporting Māori or Pacific learners. In these schools, teachers’ cultural knowledge and practice is supported by in-school specialist knowledge or staff with ethnic identities or experience. Focused professional learning opportunities and collective inquiry supports improved practice in schools that are doing well.
Examples of successful strategies shared by schools:
- Sharing of food
Several schools used a Garden to Table approach which celebrated and explored the cooking and sharing of food from different cultures. In one school this included a discussion of ingredients and processes, and a student (sometimes with a parent) to act as an “expert” for supporting the cooking process.
- Wellbeing activities
Some schools used activities to prompt connection with other students and provide a sense of belonging and opportunities for students to use their home language. These included
developing digital messages about wellbeing in learners’ own language and English which are shared with class and photographing ‘What success looks like’ in the school environment. Learners use photos to write and talk about themselves and their aspirations through writing, oral language, and/or visual presentations.
- Learning from conflicts
In several cases, teachers took opportunities to learn from conflict or cultural differences. This included being responsive to children’s questions about differences in cultural practices and taking opportunities to explore current issues about cultural matters. In one school, playground skirmishes became an opportunity to develop understanding and sensitivities about cultural insults between children from different ethnicities and ways to deal with cultural practices associated with traditional dress.
5. School leaders and teachers connect and partner with whānau and their ethnic communities
Why it matters
Strong relationships between schools, whānau, and their community are key to ensuring successful outcomes for learners from ethnic communities. It is important to involve families beyond superficial levels of engagement to participate as full contributors in their child’s education. Given that school environments and learning approaches may be unfamiliar or confusing for families from ethnic communities, navigating the home-community-school relationship effectively is crucial.
What good looks like
Through Our Code | Our Standards, the Teaching Council of Aotearoa New Zealand sets clear expectations for teachers to respect the diversity of the heritage, language, identity, and culture of families and whānau.
We know that learners benefit from home/school partnerships where there is a focus on relationship-building, and school is a safe place for whānau to participate and raise concerns, especially about cultural practices. In these schools, parents are an integral part of school life and are empowered to contribute. Teachers actively engage sensitively and regularly with whānau to support learners’ engagement and learning. They seek knowledge about, and are responsive to the aspirations, needs, and strengths of the families.
Recognising the importance of community networks and support groups is an important aspect of connecting with families. In this way, schools are able to provide authentic engagement and on-going consultation and dialogue to learn about their ethnic communities and target their approaches for different groups.
Key practices for schools:
- Ensure staff interactions with whānau are warm, welcoming, and caring.
- Provide spaces where whānau from all ethnic groups can relax and feel they belong at school.
- Provide opportunities where whānau can connect with other adults at school and contribute to school life.
- Involve parents and community members from diverse cultural and linguistic backgrounds in all stages of the school planning cycle.
- Cultural celebrations or marking of calendar events are undertaken in close partnership with whānau and ethnic communities to ensure accuracy and appropriateness.
- Build strong relationships with ethnic community leaders.
- Communicate information about school life and learning in multiple ways and languages as much as possible.
- Provide one point of contact in the school for families.
- Regularly and respectfully seek out the perspectives of whānau from ethnic communities about their concerns, planned developments, and what works best for them.
What we found
We found many schools are working hard to build relationships and connect with whānau of learners, but whānau often experience gaps in communication that impact their ability to engage with the education system.
Challenges we found
From our surveys and interviews, we found challenges faced in communication between schools and their whānau. Whānau expressed they had a lack of clarity on the education system, curriculum and learning, and assessment practices. Some whānau felt there is a lack of connection between school leaders and their communities.
Most teachers report their school has specific leaders to connect with their diverse ethnic communities. However, only 29 percent of whānau surveyed felt that members of Boards understand the needs of their ethnic communities. Around a fifth of whānau do not feel teachers understand their family’s needs or concerns (see Figure 67).
Figure 67: Parent/whānau experience of teacher intercultural understanding
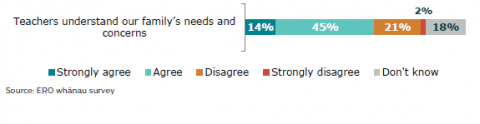
Figure 67 is a graph showing the extent to which did whānau agree that teachers understand their family’s needs and concerns.
14% reported strongly agree.
45% reported agree.
21% reported disagree.
2% reported strongly disagree.
18% reported don’t know.
Good practice we found
The importance of warm, respectful relationships was emphasised as a foundation for learners and families to participate and engage in school. In schools that do this well, school staff demonstrate a deep level of care for learners and their families. This is sometimes expressed as holistic, wrap-around support. Whānau members spoke to us about whānau-like relationships with school staff which make them feel at home. It enabled them to easily approach teachers and school leaders with any concerns or queries.
Regular, meaningful communication was identified as an important enabler for promoting partnership and sharing school and learning information. In schools that do this well, there are multiple communication platforms for sharing and listening.
When schools engage meaningfully with whānau they have positive impacts on the wellbeing of learners and their whānau.
As immigrants we know there is no support structure for us. We don’t have family here to help us out, we’re on our own and have to figure it all out ourselves - got to keep our jobs, keep our kids healthy and maintain where they should be education-wise. It’s a full plate we are trying to manage as immigrants.
This school is the epitome of education with a heart – in the first week the principal knew who my child was, who we were, was fetching her for us. It’s everywhere – even at Road Patrol – there’s so much love coming out of the school – love, acceptance. At the start of the day, the principal is there: smiling, in the rain, greets every child and parent by name, knows who the parents are – he actually cares!
And when you are leaving your children – the most important people in your lives – you are entrusting them, and it impacts you, especially if you don’t have that support of family here. You want to know that your kids are getting the love that they’re not getting from the family you’ve left behind in your home country.
- Parent
Examples of successful strategies shared:
- Parent involvement in learning
Many schools appointed multi- or bi-lingual teacher aides from within the school/parent community. As well as helping with students’ learning, these staff supported teachers’ understanding of language and cultural practices. It strengthened the school’s contact with different ethnic groups and daily contact alerted school leaders to potential issues and successes. In some cases, parents as support staff enriched their understanding of the Aotearoa New Zealand curriculum/schooling system and teaching approaches.
- Tailored information-sharing sessions
Information evenings/presentations targeted for specific ethnic groups or languages to share curriculum information or preparation for Education Outside the Classroom activities to groups of parents. These presentations included translators, cultural practices, or content. In some regions, Education Hubs provide targeted sessions for parents and their children about aspects of the Aotearoa New Zealand education system to empower them in their learning journey through education.
- Communication
Several schools ensured school notices and communications about learning were regularly translated for families. In one school they provided multiple digital or face-to-face platforms for engaging with families. Digital platforms were well monitored and included translation options – both for parents reading and replying to the school.
- Seeking feedback
In several schools, leaders make opportunities to listen and seek feedback from whānau and ethnic communities. This occurs through regular meetings with community leaders (for example, mosque leaders), or hosting informal coffee mornings or planned hui to listen or communicate information. These meetings incorporate culturally relevant activities and protocols.
Conclusion
There are good examples of schools and teachers who effectively support the engagement and learning of learners from ethnic communities and their whānau. However, practice is variable and barriers to engaging in learning and school life remain for both learners and their families. Improvement is needed to promote greater levels of understanding, commitment, and inclusion of cultural diversity in schools to better support the belonging, contribution of, and successful outcomes for learners from ethnic communities.
Feedback prompts
- How well do you relate to the findings in this section?
- What sits well with you?
- What is surprising?
- What is missing from this story?
Part 4: Findings and implications
This report has taken a deep look at the experiences of learners from ethnic communities in Aotearoa New Zealand. We have drawn from our seven key findings about their experiences which have implications for how we think about and deliver education going forward.
We need to recognise the implications of increasing ethnic diversity for education and plan for this in the future to make sure Aotearoa New Zealand
is a great place to learn for children and young people from diverse ethnic communities and their whānau.
This section sets out these findings, implications, and areas for consideration.
What have we learnt about the experiences of learners from ethnic communities?
In the course of this research, we spoke to, interviewed, or surveyed approximately 650 learners and whānau/community members from 40 ethnic communities across Aotearoa New Zealand. We have also learnt from the experiences of schools. We identified seven key findings.
Seven key findings
- Aotearoa New Zealand is becoming more ethnically diverse, and this is changing quickly. It is fastest in urban areas, but diversity is increasing across the country. Learners will be from a wider range of ethnic communities. By 2043, it is expected just over one in four (26 percent) learners will identify as Asian and around one in 20 (3.6 percent) will identify as Middle‑Eastern, Latin‑American or African (MELAA). In Auckland, more than two in five (43 percent) learners are expected to identify as Asian.
- Many, but not all, learners from ethnic communities achieve well in education. Looking at NCEA Level 2 results, Filipino, Indian, Japanese, Vietnamese, and Korean learners all achieve above the national average. However, there are significant differences across ethnic communities, and within all ethnic communities there are learners who are not achieving well.
- Learners from ethnic communities often do not feel they belong. Nearly one in five learners reported they frequently feel they do not belong and a third feel lonely at school. Nearly one in five also feel they have to hide their ethnic identity at school or feel excluded from activities because of their ethnic identity.
- Learners from ethnic communities experience widespread racist bullying, which too often is not taken seriously by their school. One in five learners have experienced racist bullying in the last month, and over half have seen others being bullied because of their ethnicity. Both whānau and learners report that racist bullying needs to be better identified and addressed at school.
- Whānau from ethnic communities face barriers to engaging with schools. They attend parent information meetings more than any other activity but find information about their children’s learning insufficient or confusing. They are significantly
under-represented on School Boards. - Many learners from ethnic communities go on to tertiary study, but pathways are confusing, and, for some, choices are unfairly constrained by teachers’ biases. More than one in four secondary learners report that teachers’ recommendations for their course selection are influenced by ethnicity, and only half of secondary learners are fully happy with their subject choices. Both learners and whānau find NCEA confusing.
- Teachers’ understanding of their learners, including their culture, is key to learners’ experiences at school, but this needs building. Whānau and learners are concerned about teachers’ lack of cultural knowledge and awareness. Teachers report having limited awareness of learners’ cultural and learning needs. More than half of teachers do not feel confident connecting with ethnic communities. Half of the learners from ethnic communities reported having their names mispronounced by their teacher.
Feedback prompts
- How well do you relate to the key findings identified?
- What sits well with you?
- What is surprising?
- What is missing from this story?
- Are there other findings you think are more important to identify as key findings?
Implications for the future
These seven key findings about learners from ethnic communities’ experiences in education have strong implications for how we think about the future of education in Aotearoa New Zealand. This section draws on the findings, and the OECD conceptual framework for inclusive education for diverse societies, to discuss:
a) implications for education
b) key focus areas for the future.
Implications for education
We have identified four implications when considering the future of education in Aotearoa New Zealand.
- Every school needs to be able to respond to increased diversity. Ethnic diversity is increasing across the country – not just in Auckland – and the largest changes are in the school-aged population. This increase in ethnic diversity is reflected in an increase in the diversity of cultural values, and the number of speakers speaking languages other than English. Every school needs to be able to meet the needs of learners from ethnic communities.
- Every school will need to be able to tackle racism. In Aotearoa New Zealand there is more racism than we might be aware of. Too many learners from ethnic communities involved in this research have experienced racist bullying and racial bias. We must do better.
- We need to get better at delivering education for learners from ethnic communities. We need to understand more about what quality learning experiences and outcomes diverse ethnic communities want. This may include the types and locations of schools, and subjects taught. We must increase the cultural capability of the current teaching workforce, and develop a more culturally diverse teaching workforce for the future.
- We need education to be good for learners and their whānau from ethnic communities to enable Aotearoa New Zealand to benefit from its increasing ethnic diversity. Learners and their whānau from ethnic communities have high aspirations for their learning and future pathways, and value maintaining their home languages. Supporting these aspirations and making Aotearoa New Zealand an attractive place to live for people of all ethnicities and cultures will help us strengthen our education system, workforce, culture, and relationships with other countries.
Key focus areas for the future
Many learners from ethnic communities are achieving in education but they have to overcome widespread racism, isolation, and lack of cultural understanding. We need to change. We will need action in five areas to ensure Aotearoa New Zealand is well-placed for the future.
1. Strengthen understanding of ethnic communities and what they want from education. Ethnic communities have a wide variety of perspectives, values, and priorities for education. We need to strengthen our understanding of these within the education context by:
- making people from ethnic communities visible in the data we collect and use
- giving people from ethnic communities good quality, clear, and accessible information in the languages they prefer, so they are better able to engage with policy and decisions that affect them
- making sure people from ethnic communities are meaningfully consulted on, and involved in, decisions and design of policies and services that affect them, and ensuring that their voices are heard.
2. Develop our thinking on how we meet the needs of learners from ethnic communities in Aotearoa New Zealand. By deliberately exploring how we navigate differing religions and cultural values, and the intersection between ethnicity, language, culture, and identity in Aotearoa New Zealand’s education system, we can more effectively plan for the future. The approach we choose may guide:
- education infrastructure, in terms of how and where we support people from ethnic communities to learn
- the type and number of schools, including special character schools
- the curriculum and how it is taught.
3. Recognise racism, understand the impacts, and tackle it more effectively. In some schools, teachers, learners, and others continue to allow ignorance, unconscious bias, and stereotyping to affect the way they engage with learners from ethnic communities and their whānau. This impacts on learners’ experiences of bullying, expectations of them, and options for their future study. Collectively, we need to end racism.
4. Proactively build a teaching workforce that is better able to meet the needs of learners from ethnic communities and their whānau. To ensure learners from ethnic communities have teachers that understand them and meet their learning needs, we need to transform the teaching workforce. We need to find:
- ways to strengthen the cultural competence of the current teaching workforce
- ways to make teaching an attractive profession for ethnic communities, so more choose to either train as teachers, or remain as teachers.
5. Harness the opportunities made available by the increasing ethnic diversity in Aotearoa New Zealand. Increasing ethnic diversity brings with it a wide range of opportunities that could strengthen not only Aotearoa New Zealand’s education system but our culture and economy. We need to realise these opportunities, such as:
- building on the high educational expectations ethnic communities hold for their learners by making sure learning experiences are interesting, relevant, and of an appropriate level of challenge. This would support more learners from ethnic communities to reach their potential and lead to a higher skilled workforce
- supporting the maintenance of languages so that Aotearoa New Zealand becomes more multi-lingual
- celebrating ethnic communities’ cultures and connections to communities across the world, and by doing so, support all learners to become global citizens.
These are not quick actions – they will require sustained effort over coming decades. But the cost of not acting will be immense, not only for the more than one in four learners from ethnic communities by 2043, but for New Zealand’s social cohesion, economy, and future.
Conclusion
Aotearoa New Zealand is becoming increasingly ethnically diverse. We must be a better place for learners from ethnic communities and their whānau. This will, in turn, put us in a stronger position economically and culturally as we become an even more attractive place for people from diverse ethnic communities to live, learn, work, and raise their families.
Feedback prompts
- Do you think these are the most important areas for consideration, when thinking about how we support learners and their whānau from ethnic communities in the future?
- Are there other areas for consideration you think should be included?
Part 5: Next steps
This report is a draft for consultation. Your feedback will help us develop the final Long-Term Insights Briefing, due for publication in March 2023.
Have your say
ERO welcomes your feedback on our draft Long-Term Insights Briefing (LTIB). The questions and prompts in this report are a guide only and all comments are welcome.
How to provide feedback
You can make a submission through the following link:
https://www.surveymonkey.com/r/DraftLTIBSubmission
Questions are available in the following languages: English, Arabic, Chinese (Simplified), Hindi, Japanese, Khmer, Korean, Spanish, Tagalog and Vietnamese.
You do not have to answer all questions.
The closing date for submissions is Tuesday 20th December 2022.
Next steps
The feedback received from this consultation will help us develop the final briefing.
We aim to publish the final Long-Term Insights Briefing in March 2023. The final briefing will be provided to the Associate Minister of Education. The Minister will then present the briefing to the House of Representatives. The briefing will then be examined by Select Committee.
More information
For more information, please go to the ERO’s LTIB webpage.
You can also sign up for updates or ask us any questions by emailing LTIB@ero.govt.nz.
Privacy and the Official Information Act
Please be assured that any feedback you provide will be confidential to those involved in analysing the consultation data. We will not identify any individuals in the final analysis and report writing unless you expressly give permission for this. However, submissions, including submitters’ names, and documents associated with the consultation process may be subject to an Official Information Act 1982 request. While we will collect your personal information, your personal contact details will not be shared.
Appendix 1: Methods
Mixed methods approach to data collection
Our research questions
This report focuses on examining the following key questions:
- How has ethnic diversity changed in schools and how will it change going forward?
- What are the education experiences of learners from ethnic communities and their whānau?
- What are good practices and challenges in meeting the needs of learners from ethnic communities?
- How can schools prepare for a more diverse future and how can they be supported?
This research has a strong focus on examining learner outcomes, and learner and whānau perspectives.
Through a voluntary sample of schools, this research took a deeper look at effectiveness of school and teaching practices across a wide range of areas, and heard from a wide range of school staff.
ERO partnered with the Ministry for Ethnic Communities on this project to pool our collective expertise.
ERO also worked closely with an Expert Advisory Group, and Multicultural New Zealand, whānau, academics, practitioners, and agency officials.
Analytical framework
In developing an analytical framework for this research:
- we reviewed the latest national and international research on effective practice for supporting learning and engagement for learners from diverse ethnicities.
Mixed methods approach to data collection
This research uses a complementary mix of quantitative and qualitative data sources to ensure breadth and depth in examining the key evaluation questions:
a) ensuring breadth through:
- online surveys of teachers from a sample of schools
- online surveys of learners and their parents and whānau, which were sent out via schools and ethnic community organisation networks
- literature review, administrative and international survey data, and interviews with key informants and experts.
b) ensuring depth of understanding of current practices, enablers, and challenges through:
- case studies which entailed focus groups and interviews with learners and whānau from ethnic communities, school leaders, as well asdocument analysis and site visits
- focus groups and interviews with parents and whānau and community leaders from ethnic communities
- online focus groups with school leaders.
Case study sample recruitment
We sent an email invitation for participation to 30 schools across Aotearoa New Zealand. These schools were identified from the administrative data as having high proportions of learners from ethnic communities. We selected schools which had experiences with learners from ethnic communities, and ensured good regional and demographic coverage across the country.
School visits
From the above pool, a sample of eight schools across the country participated in the case study component of this project. The schools were located in Auckland, Canterbury, Wellington, and Tauranga.
Each visit included: focus groups/interviews with learners, whānau, school leaders and teachers; document analysis; and classroom observations. The interviews were conducted by ERO’s research team, which included those with specialist experience in reviewing school practice.
Five of the eight schools were Contributing (Year 1-6) schools and the rest were Secondary. The schools were spread across most of the deciles.
School visits took place during June and July of 2022.
Focus groups with learners and whānau were guided by semi-structured questions that were developed from the relevant literature and feedback from submissions on the proposed LTIB topic. The insights from these discussions helped in understanding the patterns that emerged from the survey data.
Focus groups with school staff and Board members were guided by semi-structured questions that were developed from the framework on culturally inclusive school practice. The team was able to identify examples of challenges that schools were facing, and understand the main contributing factors.
Online focus groups with school leaders
Eight schools participated in the online school leaders’ focus groups. There were two each of Full Primary (Year 1-8), Contributing (Year 1-6) and Secondary schools and one each of Composite, and Intermediate. They were spread across most decile groups.
Interviews with sector experts and stakeholders (remote and face to face)
Fifteen interviews were conducted with key experts and stakeholders in the sector, including the Ministry of Education, Comet Auckland and academics from the University of Auckland and University of Otago.
Surveys
We invited 120 schools from across Aotearoa New Zealand to participate in our online teacher survey. These schools were identified from the administrative data as having high proportions of learners from ethnic communities. We selected schools which had experiences with learners from ethnic communities, and ensured good regional and demographic coverage across the country. We also sent the online teacher survey to schools who participated in the case studies and online focus groups.
The online learner and whānau surveys were distributed through two channels:
- the sample of 120 schools who received the teacher survey, and the schools who participated in the case studies and online focus groups
- ethnic community organisations networks.
We received survey responses from 263 teachers across 30 schools.
We received survey responses from a total of 558 learners and 1,250 parents and whānau.
Analysis of survey data
Both the learner and parents and whānau survey responses were filtered to include only those respondents who identified as being from at least one ethnicity with the definition of ethnic communities, or who responded to a translated version of the survey. We plan to undertake further analysis on the excluded responses.
Profile of parents and whānau who responded to the survey (filtered):
- Ethnicity: 4 percent Pākehā; 6 percent other European; 1 percent Māori; 1 percent Pacific Peoples; and 5 percent Filipino; 1 percent Cambodian; 1 percent Vietnamese; 28 percent Chinese; 8 percent Indian; 2 percent Sri Lankan; 5 percent Japanese; 18 percent Korean; 7 percent Other Asian; 7 percent Middle Eastern; 5 percent Latin American; 4 percent African; 5 percent Other Ethnicity.
Note: Multiple ethnicities could be selected. Percentages calculated from number of responses to this question (n=673)
Profile of learners who responded to the survey (filtered):
- Ethnicity: 15 percent Pākehā; 8 percent other European; 1 percent Māori; 3 percent Pacific Peoples; and 6 percent Filipino; 2 percent Cambodian; 1 percent Vietnamese; 26 percent Chinese; 10 percent Indian; 4 percent Sri Lankan; 2 percent Japanese; 9 percent Korean; 17 percent Other Asian; 8 percent Middle Eastern; 3 percent Latin American; 10 percent African; 8 percent Other Ethnicity.
Note: Multiple ethnicities could be selected. Percentage was calculated from number of responses to this question (n=432).
Analysis of secondary data
Various secondary data was used in this report, including NCEA achievement data from NZQA, and PISA and PIRLS data from the Ministry of Education.
Analysis, sense-making, and testing of recommendations
At the end of interviews with each school, the interviewers had synthesis and sense-making discussions to assess the practice at each school against the evaluation framework.
The interview data and open-ended comments from surveys were analysed and coded to identify key themes. The quantitative survey data was analysed using SurveyMonkey and Excel.
Following analysis of the data from the surveys and interviews, sense-making discussions were conducted to test interpretation of the results, findings, and areas for action with:
- ERO’s team of specialists in reviewing school practice
- Expert Advisory Group
- Steering Group.
We then tested and refined the findings with the following organisations to ensure they were relevant and useful:
- Ministry for Ethnic Communities
- Ministry of Education
Appendix 2: Promoting inclusive education for diverse societies – A conceptual framework61
Cerna, L., et al. (2021), Promoting inclusive education for diverse societies: A conceptual framework. OECD Education Working Papers. No. 260, OECD Publishing, Paris, https://doi.org/10.1787/94ab68c6-en.
Appendix 3: Population Projections
This report uses the most up to date available projections from StatsNZ (as at 1 November 2022). For national projections we use “National ethnic population projections: 2018(base)–2043 (update)”, published in September 2022, which is available at: https://www.stats.govt.nz/information-releases/national-ethnic-population-projections-2018base2043-update/. For regional projections we use “Subnational ethnic population projections: 2018(base)–2043”, published in March 2022, which is available at: https://www.stats.govt.nz/information-releases/subnational-ethnic-population-projections-2018base2043.
This report uses the median projections for 5 to 19-year-olds.
As noted by Stats NZ62:
These projections are not predictions. They should be used as an indication of the overall trend, rather than as exact forecasts. The projections are updated every 2–3 years to maintain their relevance and usefulness, by incorporating new information about demographic trends and developments in methods.
At the time of release, the median projection (50th percentile) indicates an estimated 50 percent chance the actual value will be lower, and a 50 percent chance the actual value will be higher, than this percentile.
National ethnic population projections indicate the future population usually living in New Zealand for eight broad and overlapping ethnic groups: 'European or Other (including New Zealander)', Māori, Asian, Pacific, Chinese, Indian, Samoan, and MELAA (Middle Eastern/Latin American/African). New Zealand’s ethnic populations are not mutually exclusive because people can and do identify with more than one ethnicity. People are included in each ethnic population they identify with.
The projections indicate probable outcomes based on different combinations of fertility, mortality, migration, and inter-ethnic mobility assumptions. Users can make their own judgement as to which projections are most suitable for their purposes.
Projection assumptions
Projection assumptions are formulated after analysing short-term and long-term trends, recent trends and patterns observed in other countries, and government policy.” (StatsNZ, 2018)
Migration
Migration assumptions are applied to each age-sex group to allow for net migration (migrant arrivals minus migrant departures). Ethnicity is not collected directly in external migration data, but the migration assumptions are based on the ethnicity of migrants derived from other government data (linked administrative sources); an assessment of recent and expected trends of arrivals and departures of New Zealand citizens and non-New Zealand citizens by birthplace; and observed intercensal ethnic population change.
The 2019–2020 years saw high net migration gains. The impact of COVID-19 and the resulting New Zealand and international border closures, significantly reduced migration flows in 2021-2022. The impact of this differs across different ethnicities. Under the median assumptions, net migration levels are assumed to increase from the 2022 low to their long-term levels (2026–2043). However, future net migration is uncertain and is assumed to fluctuate around the median.
Please see https://www.stats.govt.nz/information-releases/national-ethnic-population-projections-2018base2043-update/ for more information including the assumptions relating to: Base population, Fertility and paternity, Mortality, and Inter-ethnic mobility.
List of figures
Figure 1: Ethnicities in Aotearoa New Zealand’s population: 2006-2018
Figure 2: Proportion of ethnicities within the Asian ethnic group: 2006-2018
Figure 3: Proportion of ethnicities within the MELAA ethnic group: 2006-2018
Figure 4: Number of Aotearoa New Zealand residents who speak languages other than English: 2006-2018
Figure 5: Proportion of learners in Auckland who identify as Asian: 1996 and 2018
Figure 6: Proportion of learners in Southland who identify as Asian: 1996 and 2018
Figure 7: Ethnicity spread across school decile groups: 2021
Figure 8: Proportion of learners in Auckland who identify as Asian: 2018 and 2043
Figure 9: Proportion of learners in Southland who identify as Asian: 2018 and 2043
Figure 10: NCEA Level 2 attainment, by ethnicity: 2021
Figure 11: NCEA Level 2 attainment, by some Asian ethnicities (selected): 2021
Figure 12: NCEA Level 2 Merit and Excellence endorsements, by ethnicity: 2021
Figure 13: University Entrance attainment, by ethnicity: 2021
Figure 14: University Entrance attainment, by Asian ethnicities (selected): 2021
Figure 15: University Entrance attainment, by MELAA ethnicities: 2021
Figure 16: PISA Mathematics achievement of Asian learners, by sub-ethnicity: 2018
Figure 17: NCEA Level 2 attainment by Chinese, Middle Eastern and Latin American: 2021
Figure 18: Achievement gap between male (lower achievement) and female (higher achievement) learners by ethnicity for University Entrance (selected): 2021
Figure 19: Parent/whānau and learner agreement their schoolwork is at the right level of difficulty
Figure 20: How frequently learners are told how well they are doing and what they are good at
Figure 21: How often learners have to hide their ethnicity, or ethnicity is a barrier to participation
Figure 22: How strongly ethnicities feel their identity and values are considered by teachers (scored 0-10/disagree to agree)
Figure 23: Schools celebrate culture – learner responses
Figure 24: Schools celebrate culture – parent/whānau responses
Figure 25: Parents/whānau agreement they cannot join in with school activities, or have been treated unfairly because of their ethnic identity and/or culture
Figure 26: Learners’ experiences of racist bullying and racism
Figure 27: Likelihood of being treated unfairly by a teacher due to their (students’) ethnicity in the last 12 months
Figure 28: School takes racist bullying seriously (learner responses)
Figure 29: How often learners feel they can speak their own language at school
Figure 30: How often learners feel lonely, and feel like an outsider
Figure 31: MELAA learners’ feelings of safety, belonging, self-expression, and identity
Figure 32: Have teachers said learners’ name wrong
Figure 33: How often teachers use examples of culture in learning and helped other learners learn about cultures
Figure 34: Do parents/whānau see their child’s ethnic identity and/or culture in lessons at school
Figure 35: Overall well-being score based on the WHO-5: 2022
Figure 36: School attendance, by ethnicity: 2011-2019
Figure 37: Learners’ opinion of how important it is to attend school every day – Asian and non-Asian
Figure 38: Suspension rates per 1,000 learners, by ethnic groups: 2020
Figure 39: Age-standardised stand-down rates per 1,000 learners, by ethnic groups: 2020
Figure 40: Learners’ opinion of how important school is for their future – Asian and non-Asian
Figure 41: Reasons Asian learners want to go to school
Figure 42: Learners’ opinion of how important school is for their future – MELAA and non-MELAA
Figure 43: Learners’ opinion of how important it is to attend school every day – MELAA and non-MELAA
Figure 44: Percentage of MELAA learners who attend their school or kura all of the time (What About Me? survey)
Figure 45: Learner representation on school Boards: 2020
Figure 46: Parent/whānau participation rates in school activities
Figure 47: Ethnicity of parent representatives on Boards: 2020
Figure 48: University aspirations of learners from ethnic communities
Figure 49: Parents/whānau and learner perceptions regarding the usefulness of their learning for future work/learning
Figure 50: Secondary learners’ experience with school support on advice for future learning/work
Figure 51: Parents/whānau experience with school support on advice for future learning/work
Figure 52: Secondary learners’ experience of subject choice guidance
Figure 53: Parents/whānau experience of subject choice guidance
Figure 54: Secondary learners’ satisfaction regarding subject choices
Figure 55: Parent/whānau confusion about NCEA and Aotearoa New Zealand school system
Figure 56: Secondary learners’ confusion about NCEA
Figure 57: 2020 enrolment in Bachelors or above, by ethnicity
Figure 58: Number of teachers employed in schools, by ethnicity: 2021
Figure 59: How often learners feel ethnic identity and/or culture is respected at school
Figure 60: How well schools provide opportunities for learners to access cultural groups
Figure 61: Parent/whānau satisfaction with their child’s progress
Figure 62: Teacher confidence to connect with community to support learning
Figure 63: Teacher confidence incorporating learners’ cultural knowledge into teaching and learning
Figure 64: Teachers’ knowledge of the cultures of their learners
Figure 65: Teacher confidence in delivering culturally responsive learning
Figure 66: Parent/whānau experience of teacher intercultural understanding
Endnotes and references
- Education Review Office. (2022). Embracing Diverse Cultures: Schools’ Practice
- Embracing Diverse Cultures: Schools’ Practice | Education Review Office (ero.govt.nz)Education Review Office. (2002). Long-Term Insights Briefing: Summary of submissions and topic decision Long-Term Insights Briefing: Summary of submissions and topic decision | Education Review Office (ero.govt.nz)Long-Term Insights Briefing: Summary of submissions and topic decision | Education Review Office (ero.govt.nz)
- Statistics New Zealand. (n.d.). Ethnicity. https://www.stats.govt.nz/topics/ethnicity
- Ministry for Ethnic Communities. (2021, July 29). Our communities. https://www.ethniccommunities.govt.nz/community-directory
- Parliamentary Counsel Office. (n.d.). Education and Training Act 2020 no 38 (as at 01 July 2022), Public Act contents – New Zealand legislation. New Zealand Legislation. https://www.legislation.govt.nz/act/public/2020/0038/latest/LMS170676.html
- Education Council. (n.d.). Our codes, our standards. Teaching Council of Aotearoa New Zealand. https://teachingcouncil.nz/assets/Files/Code-and-Standards/Our-Code-Our-Standards-Nga-Tikanga-Matatika-Nga-Paerewa.pdf
- Education Council. (n.d.). Our codes, our standards. Teaching Council of Aotearoa New Zealand. https://teachingcouncil.nz/assets/Files/Code-and-Standards/Our-Code-Our-Standards-Nga-Tikanga-Matatika-Nga-Paerewa.pdf
- Education Council. (n.d.). Our codes, our standards. Teaching Council of Aotearoa New Zealand. https://teachingcouncil.nz/assets/Files/Code-and-Standards/Our-Code-Our-Standards-Nga-Tikanga-Matatika-Nga-Paerewa.pdf
- Cerna, L., et al. (2021), Promoting inclusive education for diverse societies: A conceptual framework. OECD Education Working Papers. No. 260, OECD Publishing, Paris, https://doi.org/10.1787/94ab68c6-en.
- Cerna, L., et al. (2021), Promoting inclusive education for diverse societies: A conceptual framework. OECD Education Working Papers. No. 260, OECD Publishing, Paris, https://doi.org/10.1787/94ab68c6-en
- Stats NZ. (n.d.). Subnational Population Projections 2018-base (March 2022)
- Stats NZ. (n.d). Ethnic group (detailed total response - level 3) by age and sex, for the census usually resident population count, 2006, 2013, and 2018 Censuses
- Stats NZ. (n.d). Ethnic group (detailed total response - level 3) by age and sex, for the census usually resident population count, 2006, 2013, and 2018 Censuses
- Stats NZ. (n.d.). Ethnic group (detailed total response - level 3) by birthplace (detailed NZ or overseas born) by age group, for the census usually resident population count, 2006, 2013, and 2018 Censuses
- Stats NZ. (n.d). Ethnic group (detailed total response - level 3) by age and sex, for the census usually resident population count, 2006, 2013, and 2018 Censuses
- Stats NZ. (n.d). Ethnic group (detailed total response - level 3) by age and sex, for the census usually resident population count, 2006, 2013, and 2018 Censuses
- Stats NZ. (n.d.). Birthplace (New Zealand or overseas) and ethnic group (grouped total responses) by languages spoken (17 languages), for the census usually resident population count, 2006, 2013, and 2018 Censuses
- Stats NZ. (n.d.). Ethnic Group (Grouped Total Responses) by Age Group, for the Census Usually Resident Population Count, 1991, 1996, 2001 and 2006
- Stats NZ. Subnational Population Projections 2018-base (March 2022)
- Stats NZ. (n.d.). Ethnic Group (Grouped Total Responses) by Age Group, for the Census Usually Resident Population Count, 1991, 1996, 2001 and 2006
- Stats NZ. Subnational Population Projections 2018-base (March 2022)
- Stats NZ. (n.d.). Ethnic group (grouped total responses) and number of languages spoken by age group and sex, for the census usually resident population count, 2006, 2013, and 2018 Censuses.
- Ministry of Education. (2020), TIMSS2018/19 Science Year 5. https://www.educationcounts.govt.nz/__data/assets/pdf_file/0004/205708/TIMSS-2018-Year-5-Science.pdf (p.71)
- Stats NZ. (n.d). Ethnic group (detailed total response - level 3) by age and sex, for the census usually resident population count, 2006, 2013, and 2018 Censuses
- Stats NZ. 2018 Census of Population and Dwellings
- Stats NZ. (n.d.). National ethnic population projections: 2018-base update (September 2022)
- Stats NZ. (n.d.) Subnational Population Projections 2018-base (March 2022)
- Stats NZ. (n.d.). National ethnic population projections: 2018-base update (September 2022)
- Stats NZ. (n.d.). Subnational Population Projections 2018-base (March 2022)
- Stats NZ. (n.d.) Subnational Population Projections 2018-base (March 2022)
- National ethnic population projections: 2018(base)–2043. Statistics New Zealand. 2018. https://www.stats.govt.nz/information-releases/national-ethnic-population-projections-2018base-2043
- Stats NZ (n.d). Ethnic group (detailed total response - level 3) by age and sex, for the census usually resident population count, 2006, 2013, and 2018 Censuses
- Stats NZ (n.d.). Subnational Population Projections 2018-base (March 2022)
- Stats NZ. (n.d). Ethnic group (detailed total response - level 3) by age and sex, for the census usually resident population count, 2006, 2013, and 2018 Censuses
- Stats NZ. (n.d.). Subnational Population Projections 2018-base (March 2022)
- Ministry for Social Development. (2022). What About Me - The biggest survey of your generation. https://www.msd.govt.nz/about-msd-and-our-work/publications-resources/consultations/youth-health-and-wellbeing-survey-results/index.html
- Paradies Y, Ben J, Denson N, Elias A, Priest N, Pieterse A, et al. (2015) Racism as a Determinant of Health: A Systematic Review and Meta-Analysis. PLoS ONE 10(9): e0138511. https://doi.org/10.1371/journal.pone.0138511
- Alansari, M., Hunia, M., & Eyre, J. (2020). A rapid review of racism in schools. NZCER; Turner, H., Rubie-Davies, C. M., & Webber, M. (2015). Teacher expectations, ethnicity and the achievement gap. New Zealand Journal of Educational Studies, 50(1), 55-69; Webber, M., McKinley, E., & Hattie, J. (2013). The importance of race and ethnicity: An exploration of New Zealand Pākehā, Māori, Samoan and Chinese adolescent identity. New Zealand Journal of Psychology, 42(2).
- Harris, R. B., Stanley, J., & Cormack, D. M. (2018). Racism and health in New Zealand: Prevalence over time and associations between recent experience of racism and health and wellbeing measures using national survey data. PloS one, 13(5), e0196476; Paine, S. J., & Stanley, J. (2020). Caregiver experiences of racism are associated with adverse health outcomes for their children: A cross-sectional analysis of data from the New Zealand Health Survey. Critical Public Health, 30(5), 509-520:Priest, N., Paradies, Y., Trenerry, B., Truong, M., Karlsen, S., & Kelly, Y. (2013). A systematic review of studies examining the relationship between reported racism and health and wellbeing for children and young people. Social Science & Medicine, 95, 115-127; Talamaivao, N., Harris, R., Cormack, D., Paine, S. J., & King, P. (2020). Racism and health in Aotearoa New Zealand: A systematic review of quantitative studies. The New Zealand Medical Journal (Online), 133(1521), 55-5.
- ibid.
- Harris, R. B., Stanley, J., & Cormack, D. M. (2018). Racism and health in New Zealand: Prevalence over time and associations between recent experience of racism and health and wellbeing measures using national survey data. PloS one, 13(5), e0196476; Paine, S. J., & Stanley, J. (2020). Caregiver experiences of racism are associated with adverse health outcomes for their children: A cross‑sectional analysis of data from the New Zealand Health Survey. Critical Public Health, 30(5), 509 – 520; Priest, N., Paradies, Y., Trenerry, B., Truong, M., Karlsen, S., & Kelly, Y. (2013). A systematic review of studies examining the relationship between reported racism and health and wellbeing for children and young people. Social Science & Medicine, 95, 115 – 127; Talamaivao, N., Harris, R., Cormack, D., Paine, S. J., & King, P. (2020). Racism and health in Aotearoa New Zealand: A systematic review of quantitative studies. The New Zealand Medical Journal (Online), 133(1521), 55 – 5.
- Harris, R. B., Stanley, J., & Cormack, D. M. (2018). Racism and health in New Zealand: Prevalence over time and associations between recent experience of racism and health and wellbeing measures using national survey data. PloS one, 13(5), e0196476; Paine, S. J., & Stanley, J. (2020). Caregiver experiences of racism are associated with adverse health outcomes for their children: A cross‑sectional analysis of data from the New Zealand Health Survey. Critical Public Health, 30(5), 509 – 520; Priest, N., Paradies, Y., Trenerry, B., Truong, M., Karlsen, S., & Kelly, Y. (2013). A systematic review of studies examining the relationship between reported racism and health and wellbeing for children and young people. Social Science & Medicine, 95, 115 – 127; Talamaivao, N., Harris, R., Cormack, D., Paine, S. J., & King, P. (2020). Racism and health in Aotearoa New Zealand: A systematic review of quantitative studies. The New Zealand Medical Journal (Online), 133(1521), 55 – 5.
- See for example: Ben, J. (2022). “People love talking about racism”: Downplaying discrimination, and challenges to anti‑racism among Eritrean migrants in Australia. Ethnic and Racial Studies, 1 – 23; Ellemers, N., & Barreto, M. (2015). Modern discrimination: How perpetrators and targets interactively perpetuate social disadvantage. Current Opinion in Behavioral Sciences, 3, 142 – 146; Ruggiero, K.M., & Taylor, D.M. (1997). Why minority group members perceive or do not perceive the discrimination that confronts them: The role of self‑esteem and perceived control. J Pers Soc Psychol. 72(2), 373.Harris, R. B., Stanley, J., & Cormack, D. M. (2018). Racism and health in New Zealand: Prevalence over time and associations between recent experience of racism and health and wellbeing measures using national survey data. PloS one, 13(5), e0196476
- See for example: Sue, D. W., Capodilupo, C. M., Torino, G. C., Bucceri, J. M., Holder, A., Nadal, K. L., & Esquilin, M. (2007). Racial microaggressions in everyday life: Implications for clinical practice. American psychologist, 62(4), 271.
- Ministry of Education. (2019). He Whakaaro: What do we know about discrimination in schools He Whakaaro: What do we know about discrimination in schools? September 2019 | Ministry of Education (education.govt.nz)
- Ministry for Social Development. (n.d.). What About Me - The biggest survey of your generation. https://www.msd.govt.nz/about-msd-and-our-work/publications-resources/consultations/youth-health-and-wellbeing-survey-results/index.html
- Cerna, L., et al. (2021), Promoting inclusive education for diverse societies: A conceptual framework. OECD Education Working Papers. No. 260, OECD Publishing, Paris, https://doi.org/10.1787/94ab68c6-en.
- Grissom, Jason A., Anna J. Egalite, and Constance A. Lindsay. (2021). How Principals Affect Students and Schools: A Systematic Synthesis of Two Decades of Research. New York: The Wallace Foundation. Available at http://www.wallacefoundation.org/principalsynthesis
- Cardno, C., Handjani, M., & Howse, J. (2017). Leadership practices and challenges in managing diversity to achieve ethnic inclusion in two New Zealand secondary schools. New Zealand Journal of Educational Studies, 53(1), 101-117. https://doi.org/10.1007/s40841-017-0096-x; Ryan, J. (2006a). Inclusive leadership. San Francisco: Jossey-Bass; Zanoni, P., & Mampaey, J. (2013). Achieving ethnic minority students’ inclusion: A Flemish school’s discursive practices countering the quasi-market pressure to exclude. British Educational Research Journal, 39(1), 1–21.
- Ainscow, M. (2016). Collaboration as a strategy for promoting equity in education: Possibilities and barriers. Journal of Professional Capital and Community, 1(2). https://doi.org/10.1108/jpcc-12-2015-0013; Bishop, R. (2011). Making it possible for minoritized1 students to take on student leadership roles. Leading and Managing, 17(2), 110–121.
- Teaching Council. (n.d.). The code of professional responsibility. Teaching Council of Aotearoa New Zealand. https://teachingcouncil.nz/assets/Files/Code-and-Standards/Code-of-Professional-Responsibility-English-one-page.pdf
- Massey University CaDDANZ. (2017). ESOL students’ sense of school belonging, inclusion, and wellbeing.
- Harding-DeKam, J. L. (2014). Defining culturally responsive teaching: The case of mathematics. Cogent Education, 1(1), 972676. https://doi.org/10.1080/2331186x.2014.972676
- Robinson, V. M., Hohepa, M. K., Lloyd, C., & New Zealand. Ministry of Education. (2009). School leadership and student outcomes: Identifying what works and why: Best evidence synthesis iteration [BES]. Australian Council for Educational Leaders.Ryan, J. (2006). Inclusive leadership and social justice for schools. Leadership and Policy in Schools, 5(1), 3-17. https://doi.org/10.1080/15700760500483995
- Teaching Council. (n.d.). The code of professional responsibility. Teaching Council of Aotearoa New Zealand. https://teachingcouncil.nz/assets/Files/Code-and-Standards/Code-of-Professional-Responsibility-English-one-page.pdf
- National Institute of Standards and Technology. (2019, November 15). Montgomery County public schools. NIST. https://www.nist.gov/baldrige/montgomery-county-public-schools
- Hargraves, V. (2019, December 5). What is culturally responsive teaching? THE EDUCATION HUB. https://theeducationhub.org.nz/what-is-culturally-responsive-teaching/
- Hargraves, V. (2019, December 5). What is culturally responsive teaching? THE EDUCATION HUB. https://theeducationhub.org.nz/what-is-culturally-responsive-teaching/
- Teaching Council. (n.d.). The code of professional responsibility. Teaching Council of Aotearoa New Zealand. https://teachingcouncil.nz/assets/Files/Code-and-Standards/Code-of-Professional-Responsibility-English-one-page.pdf
- Cerna, L., et al. (2021), Promoting inclusive education for diverse societies: A conceptual framework. OECD Education Working Papers. No. 260, OECD Publishing, Paris, https://doi.org/10.1787/94ab68c6-en.
- Cerna, L., et al. (2021), Promoting inclusive education for diverse societies: A conceptual framework. OECD Education Working Papers. No. 260, OECD Publishing, Paris, https://doi.org/10.1787/94ab68c6-en.
- Stats NZ. (2022). Information-release: National Ethnic Population Projections 2018base2043-update. Stats NZ. https://www.stats.govt.nz/information-releases/national-ethnic-population-projections-2018base2043-update/